Table of Contents
Great systems are not just built. They are monitored.
MetricFire runs Graphite and Grafana as a fully managed service for growing engineering teams, taking care of storage, scaling, and version updates so your team doesn't have to. Plans start at $19/month, billed per metric namespace rather than per host, and include engineer-staffed support. Integrations work natively with Heroku, AWS, Azure, and GCP, and data is stored with 3× redundancy in SOC2- and ISO:27001-certified data centres.
With the nearly unmatched reliability and scalability offered by the 12-factor application design pattern, microservice-based designs have become a fundamental architectural pattern for modern applications. A whole industry of cloud providers has sprung up to offer management of the sophisticated middleware and infrastructure services that make this possible. Amazon Web Services (AWS) is among the largest of them. AWS provides various services to promote microservices-based applications at every level, defined in this article as computing, persistence, and visibility. The AWS array allows an organization to find the right fit and get a quick start on implementation without having to build extensive in-house talent.
This article will discuss the pros and cons of AWS offerings in all three categories to help you find the best product for your application needs. You will find information about:
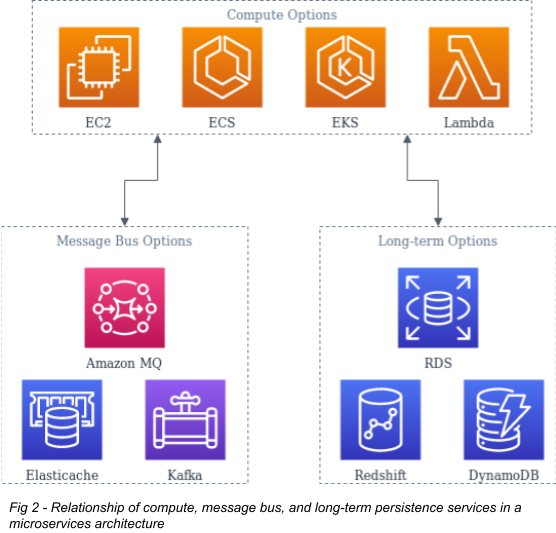
- Compute: Lambda, Fargate, and EKS
- Data Persistence: Message Bus options, RDS, DynamoDB, Redshift
- Visibility: AWS Cloudwatch
In addition to providing an overview of AWS products, the article makes some recommendations for third-party and open-source products that can help fill the gaps in AWS offerings.
Compute Options
Compute refers to the CPU and RAM resources you run your software with. If you're using microservices, you will likely be using containers or serverless for at least part of your application stack, so that is where this article will focus.
Lambda
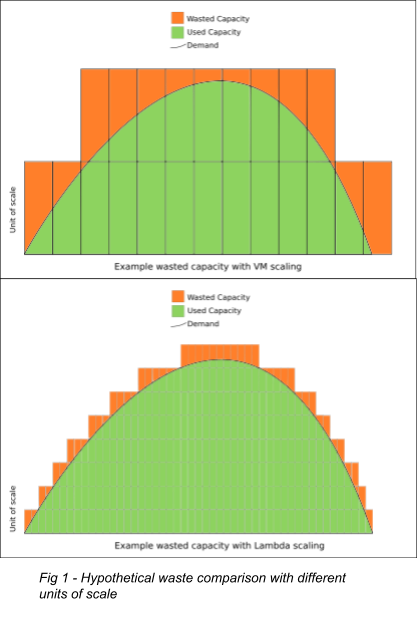
The most unusual modern means to access computing is Function as a Service (FaaS). Also known as serverless, this technology avoids long-lived infrastructure of any kind by creating a function only when a request comes in and destroying it as soon as it is fulfilled. This allows the scalability curve of your application to track closer to your demand curve than any other method and forces programming practices that ensure seamless horizontal scalability.
Lambda, Amazon's FaaS service, supports many languages, and most executables can be used via a callout from a supported language. Lambda responds to events from various sources within AWS, but the most common trigger in a user-facing application is created via the AWS API Gateway service. The Gateway service provides a consistent API surface for end users to interact with, which can route requests inward to one or more Lambdas for processing.
With a strong message-passing layer like Kafka or Active MQ, an entirely Lambda-based architecture is possible—and sometimes even desirable. This is the case, for example, when large usage spikes are unpredictable. Because the scaling curve matches the usage so closely, there's little waste in infrastructure overhead. Lambda's additional cost per compute cycle is offset by the low cost incurred during low utilization periods.
More commonly, though, Lambdas are used to augment a more traditional infrastructure style, handling rare and potentially compute-intense requests like processing uploads or interaction with a third-party system. Triggered from S3 events or requests at API gateways, Lambdas allows the central application deployment to ignore the random additional load these tasks create.
While very helpful, FaaS is not a panacea. If your application sees consistent demand, the overhead cost may make FaaS more expensive than traditional always-on options like containers or VMs. Startup times for functions can be problematic in some cases as well. Specifically, while AWS aims to have Lambdas instantiate in only a few milliseconds, the actual time required will vary by the size and complexity of Lambda itself. For this reason, it's often better to have a handful of smaller Lambdas rather than one large one. Your Lambdas must be free of significant memory contexts to be loaded when they initialize because this slows the loading of the Lambda significantly. In this case, the application is better designed as a long-running service so that memory context can be initialized once and re-used to serve many requests. Nonetheless, FaaS services are an essential tool that can help keep costs low and scalability high when appropriately applied.
Fargate and ECS
The next step towards more traditional notions of computing infrastructure is the Fargate service. This runs specifically configured Docker containers on an abstracted and AWS-managed infrastructure.
Fargate is closely related to the Elastic Container Service (ECS), and it is managed under the umbrella of ECS. They both use the same configuration primitives of Tasks and Services and have generally similar management overhead. However--unlike Fargate-- with traditional ECS, the end-user must manage the underlying infrastructure. If your group has or wants to acquire expertise in that area, using traditional ECS instead of Fargate can deliver more savings when comparing the compute cost of a workload--ECS itself is free; you are only charged for the Amazon Compute Cloud (EC2) resources used as part of your ECS cluster.
An infrastructure deployed on ECS can support anything that runs in a container so that most legacy monolithic applications can live there happily. However, if you have periodic bursty workloads (like builds or data analysis jobs) you can avoid designing your ECS cluster for peak demand by configuring said workloads to run in Fargate containers instead. Like Lambda, Fargate is a way to make the cost of your infrastructure more closely match your demand curve. Despite the premium charged for the computing resources, there will be net savings when there is a highly variable demand.
ECS is AWS's oldest offering in the container orchestration space and has seen minor improvements since it was first introduced in 2014. It works well if you only use it to deploy microservice-based applications that communicate exclusively with REST or other HTTP-based protocols. Things get more complicated if you introduce services that need to speak with TCP or on multiple ports. ECS also needs to improve if you have specific scheduling requirements regarding which services can be co-located with one another on a physical host. Fargate addresses some of these shortcomings indirectly by using the abstraction it provides. If you require more control, not less, you need a more sophisticated orchestration system for your containers like Kubernetes (k8s), which brings us to the Elastic Kubernetes Service (EKS).
Elastic Kubernetes Service
Kubernetes is flexible, efficient, scalable, and easy for consumers to work with. EKS is AWS's managed K8s offering. It allows teams to leverage the vast array of tools and patterns built up to work with K8s without having to actually manage K8s themselves.
While EKS comes at a premium, its benefit in the form of lower management overhead can be significant, especially for smaller teams. It's also important to note that EKS is certified to be k8s conformant: any tooling that works with standard k8s will work with EKS, and EKS can integrate with k8s run in a local data center or another cloud provider. This avoids vendor lock-in, provides significant flexibility, and is a valuable onramp to hybrid-cloud infrastructure. One of the advancements in k8s is the variety of options for persistent container storage. This is useful primarily for running legacy workloads. In most microservices deployments, you won't be using container-attached storage. However, it would help if you had a way to store and communicate state in your application, and AWS offers several options for achieving state and data persistence.
Application State Persistence
Persistence is the means used to store data and communicate state among the various components of the application. The persistence layer can come in many forms depending on the application's needs and the designers' preferences. Persistence in this definition isn't just long-term data storage but also maintaining the application's state while it's in use. Moving this information out of the memory of the services running the app makes them stateless, which means they can be safely killed and created at any time, one of the tenets of the 12-factor design. As a result, it's very common in a microservices design to have some message bus, a system where information about the running state of the application is stored.
Message Bus Options
Three widely used pieces of software that fall into this category are Redis, Active MQ, and Kafka. AWS has managed offerings of each of them: Elasticache, Amazon MQ, and MSK, respectively. Most are priced slightly higher than a bare EC2 compute node of a similar size. You will sacrifice some control to avoid managing and deploying these systems yourself, but this is a good tradeoff in many cases. If you need a deployment at least as large as their minimum sizes, the small premium is worth it. If you do not, you must account for the cost of managing a relatively complicated piece of software by yourself. Redis is pretty accessible, so it is a good candidate for self-management if you're on the fence; active MQ and Kafka are more complex.
Because each service requires an additional investment in time and training, I suggest starting with the managed service if it is within your budget. Then, create space to learn the system and move to self-management as your needs dictate. This is even more applicable to long-term persistence services.
RDS
RDS is a high-level offering that provides a few different databases to meet your particular needs, including Postgres, MySql, Maria DB, Oracle, MS SQL, and Amazon Aurora. Aurora is particularly well-suited to microservice-based architectures. It can be compatible with Postgres or MySQL, making migrating to it easy in most cases. Amazon claims that it is significantly faster than the original systems it replaces. Most importantly, though, Aurora is designed to scale seamlessly and be highly fault-tolerant, addressing the biggest shortcoming of even very well-managed traditional RDBS deployments: usually a single point of failure that is very difficult to eliminate. Aurora claims to have done that.
DynamoDB
DynamoDB is the primary NoSQL offering from AWS. NoSAL services are another way to eliminate that single point of failure for highly distributed systems like microservices. Other popular examples include CouchDB, Cassandra, Riak, and MongoDB. Each one is tuned for particular use cases but is primarily interchangeable conceptually. They are meant to replace or augment a traditional RDBS and provide data storage in a "cloud-native" manner. In practice, they can scale horizontally by adding more servers to a cluster more efficiently than a traditional RDBS. The horizontal scalability provides benefits to performance and reliability by spreading the workaround, but also lets you manage data volumes that far exceed what would be possible with monolithic RDBS.
Redshift
Data warehousing primarily provides business intelligence and analytics services over huge data sets. Often, this is in the form of data that has been cubed. Simply put, this is not only the data but also how it has changed over time. Adding this element of time is one factor that has forced people to re-think data storage for real-time analytics because traditional RDBS weren't designed for this. Redshift solves this through column-oriented data storage and massively parallel computing resources. It is accessed through a (mostly) Postgres-compatible SQL syntax.
In practice, a mature microservices-based application will likely need multiple kinds of storage to meet its users' requirements. AWS has managed offerings in all of the major categories of data storage systems and regularly adds new ones. These services offer a level of performance and reliability that would be difficult to match using a self-managed deployment.
Visibility
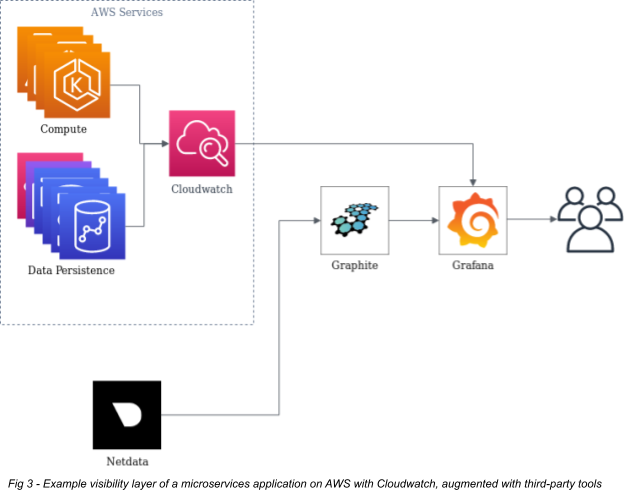
The final layer of a microservices-based system is visibility, which refers to how you get insights into what the services are doing, letting you make improvements as needed. Some people consider this a separate entity, but I disagree with that position. One major criticism against microservice architectures is that their complexity makes them too difficult to troubleshoot. The best way to combat this problem is to design the visibility layer with the rest of the application and infrastructure and to treat it as a similarly distributed system. You can do this via metrics collection and log aggregation. AWS provides this primarily under their Cloudwatch service. It is simple to deploy and relatively inexpensive based on what it offers.
However, there will come a point where Cloudwatch won't meet your needs. Visibility at large is one area where AWS is surprisingly weak. Many of their services only provide some metrics that an operations group needs. If they do offer them, the ability to visualize and dashboard them in Cloudwatch is limited. Log aggregation also leaves something to be desired: each AWS service can produce logs differently. Many, but not all, can send logs directly to Cloudwatch. Some store their logs as streams of files to S3. Others store them internally to the service itself. They must be extracted via the management console or API and then fed into another system for aggregation.
I recommend adding more fine-grained metrics collection, a time-series database (TSDB) for long-term metrics storage, and a visualization and dashboarding system to augment what AWS provides. Netdata (metrics), Graphite (TSDB), and Grafana (Dashboard) are all prominent examples of Open-Source tools that fill the gaps in the AWS offerings. Together, they offer superior real-time and historical visibility into metrics and powerful dashboarding options while still remaining manageable for small teams.
You'll also want a more sophisticated log aggregation tool as your needs grow. Cloudwatch Logs is limited in this space, and they only recently started adding features to make it more robust. A promising Open Source alternative is Loki. It is a Prometheus-like log aggregator that is relatively new but gaining traction. The standard self-managed tool for this is the Elasticstack suite of tools built around Elasticsearch. It generally works very well but can be particularly complicated to manage and use. AWS offers a managed Elasticstack service, but they are very prescriptive in configuring and using it, so you may be unable to leverage it.
The final piece of visibility tooling that is especially valuable for microservices is an application performance monitoring (APM) system. APM tools are generally a combination of a probe built into the application to be monitored and a data aggregation and analysis service used to view the data coming from the probes. AWS has yet to offer an offering in this space, and I'm not aware of any open-source options (at the time of writing), but many commercial products are available. Some examples include New Relic APM, Appdynamics, and Dynatrace. They are expensive, but if you are operating microservices at a sufficiently large scale, they provide insights that would be very difficult to obtain otherwise.
Conclusion
The array of tools that AWS offers to support microservice-based applications is impressive. They provide a sufficiently gentle onramp to help newcomers get started but enough power and flexibility to meet the needs of even the most demanding applications. If AWS puts more effort into improving the visibility elements of its services, it could be a one-stop-shop for the microservice application architect. Until then, there are various ways to fill those gaps with free or Open Source tools or SaaS offerings from third parties.
If you want to try it out, sign up for our free trial. You can also sign up for a demo, and we can discuss the best Hosted monitoring solutions for you.


