Table of Contents
Great systems are not just built. They are monitored.
MetricFire runs Graphite and Grafana as a fully managed service for growing engineering teams, taking care of storage, scaling, and version updates so your team doesn't have to. Plans start at $19/month, billed per metric namespace rather than per host, and include engineer-staffed support. Integrations work natively with Heroku, AWS, Azure, and GCP, and data is stored with 3× redundancy in SOC2- and ISO:27001-certified data centres.
Introduction
If you're looking for a straightforward way to collect NGINX metrics via OpenTelemetry and send them to your Graphite-based monitoring setup, this article is for you! With minimal configuration you’ll be collecting key metrics from your NGINX connections within minutes.
In this article, we'll explain how to install the OpenTelemetry Collector, and easily configure it to receive and export NGINX metrics to a Hosted Carbon endpoint.
Getting Started With NGINX
NGINX is a fast, lightweight web server and reverse proxy that handles high traffic without hogging resources. It’s popular for its speed, built-in load balancing, and how easily it fits into modern apps. With more developers moving to cloud-based and containerized setups, NGINX has become a go-to for keeping things scalable and secure.
Install/Configure NGINX (Linux)
This article assumes that you are already running an instance of NGINX on your server, but if you want to just follow along for testing purposes, here's how to get this up and running quickly on a Linux server:
sudo apt install -y nginx
By default, it listens on port 80—so check to see if something else is using that port:
sudo netstat -tulnp | grep :80
The stub_status module in NGINX provides real-time server health metrics like active connections, handled requests, and connection states (reading, writing, waiting). To enable it, add a location block in your NGINX config, typically at: /etc/nginx/sites-available/default:
server {
    listen 80 default_server;
    listen [::]:80 default_server;

    location /nginx_status {
        stub_status;
        allow 127.0.0.1;
        deny all;
    }
}
Save your changes and restart NGINX:
sudo systemctl restart nginx
sudo systemctl status nginx
Test the endpoint to confirm that it's working:
curl http://localhost:80/nginx_status
Expected output should be similar to this:
Active connections: 2
server accepts handled requests
110 110 292
Reading: 0 Writing: 1 Waiting: 1
Install and Configure OpenTelemetry
OpenTelemetry as a Collector has built-in support for NGINX, PostgreSQL, Redis, Kafka, and many more! These Receivers pull key performance metrics directly from your services—no manual parsing or custom scripts needed. This article assumes you already use OpenTelemetry, but below are examples of how to install and configure otelcol-contrib to quickly collect system metrics and export them to a Carbon endpoint.
Install OpenTelemetry Collector Contrib (Linux)
/etc/otelcol-contrib/Ubuntu/Debian (AMD)
wget https://github.com/open-telemetry/opentelemetry-collector-releases/releases/download/v0.119.0/otelcol-contrib_0.119.0_linux_amd64.deb

sudo dpkg -i otelcol-contrib_0.119.0_linux_amd64.deb
RedHat/CentOS (AMD)
wget https://github.com/open-telemetry/opentelemetry-collector-releases/releases/download/v0.119.0/otelcol-contrib_0.119.0_linux_amd64.rpm

sudo rpm -ivh otelcol-contrib_0.119.0_linux_amd64.rpm
Confirm Installation
otelcol-contrib --version
Configure the NGINX Receiver and Carbon Exporter
The NGINX Receiver in OpenTelemetry collects metrics from localhost:80/nginx_status, processes them, and forwards them to your exporter of choice.
The Carbon Exporter takes those metrics and ships them straight to Graphite-compatible backends, making it easy to integrate OpenTelemetry into existing monitoring stacks with minimal setup.
If you're not currently hosting your own Graphite data source, start a 14-day free trial with Hosted Graphite by MetricFire to continue following along with this example!
A MetricFire account will provide the Graphite data source and include Hosted Grafana as a visualization tool - along with Alerting, Integrations, and Team features.
- First, find the configuration file generally located at: /etc/otelcol-contrib/config.yaml and open it in your preferred text editor.
- Then you can either replace the file, or add the following sections to your current config.
- Be sure to include your HG-API-KEY and HOSTNAME.
receivers:
  nginx:
    endpoint: "http://localhost:80/nginx_status"

processors:
  batch: {}
  metricstransform:
    transforms:
      - include: ".*"
        match_type: regexp
        action: update
        new_name: "<HG-API-KEY>.opentel.$$0"
        operations:
          - action: add_label
            new_label: host
            new_value: <HOSTNAME>

exporters:
  carbon:
    endpoint: "carbon.hostedgraphite.com:2003"
    timeout: 10s

service:
  pipelines:
    metrics:
      receivers:
        - nginx
      processors:
        - batch
        - metricstransform
      exporters:
        - carbon
Now, just save the file and restart the otelcol-contrib service:
sudo systemctl restart otelcol-contrib
sudo systemctl status otelcol-contrib
Or you can server the file manually - to troubleshoot potential configuration errors:
otelcol-contrib --config /etc/otelcol-contrib/config.yaml
For details around configuring OTel to collect/forward Prometheus NGINX metrics, see our related article HERE.
Ship Tagged Graphite Metrics
Within two minutes of restarting the otelcol-contrib service, a handful of Tagged Graphite metrics will be forwarded to your Hosted Graphite account (with the opentel prefix).
Why does OpenTelemetry export Tagged metrics to Carbon?
- Because it's core model aligns more with Prometheus-style 'labels' than Graphite's 'dot notation' formatting. Instead of flattening data into long metric names, it preserves the labels by using Graphite tags, which enables richer filtering in your Graphite backend.
Now you can locate these Tagged Metrics in the Hosted Graphite Tag Search UI - under the host tag:
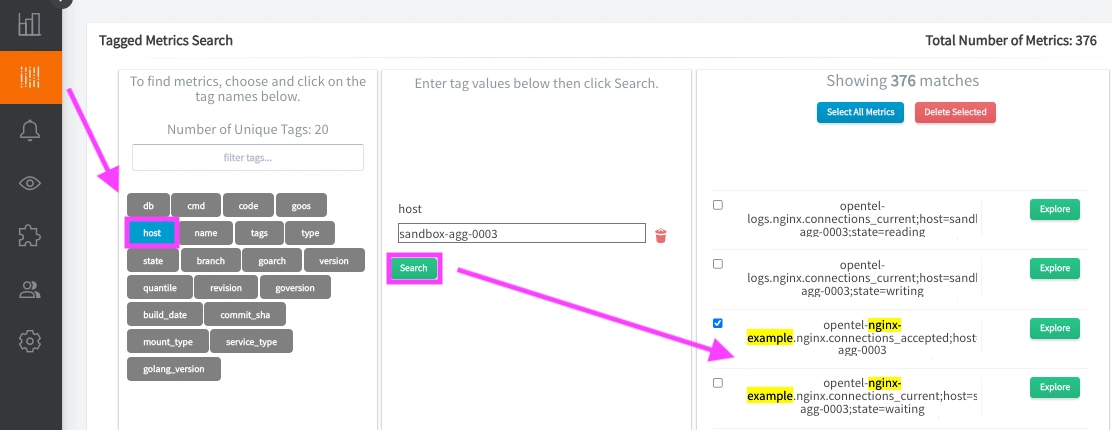
Otherwise, you can configure a different exporter to forward metrics to another data source.
Use Hosted Graphite by MetricFire to Create Custom Dashboards and Alerts
MetricFire is a monitoring platform that enables you to gather, visualize and analyze metrics and data from servers, databases, networks, processes, devices, and applications. Using MetricFire, you can effortlessly identify problems and optimize resources within your infrastructure. Hosted Graphite by MetricFire removes the burden of self-hosting your monitoring solution, allowing you more time and freedom to work on your most important tasks.
Metrics sent to the public carbon endpoint will be timestamped, and aggregated into the Hosted Graphite backend.
-
OpenTelemetry metrics will be sent and stored in the Graphite Tag format of: my.series;tag1=value1;tag2=value2 metric_value (timestamp)
-
The tags provide a filtering option, making the metrics efficient to query
-
Metrics are stored in your Hosted Graphite account for two years, and you can use them to create custom Dashboards and Alerts.
Build Custom Dashboards in MetricFire's Hosted Grafana
In the Hosted Graphite UI, navigate to Dashboards and select + New Dashboard to create a new visualization.
Then go into Edit mode and use the Query UI to select a graphite metric path (the default data source will be HostedGraphite if you are accessing Grafana via your HG account).
NOTE: To query Tagged metrics, you must apply the seriesByTag Graphite function - the aliasByTags function is optional.
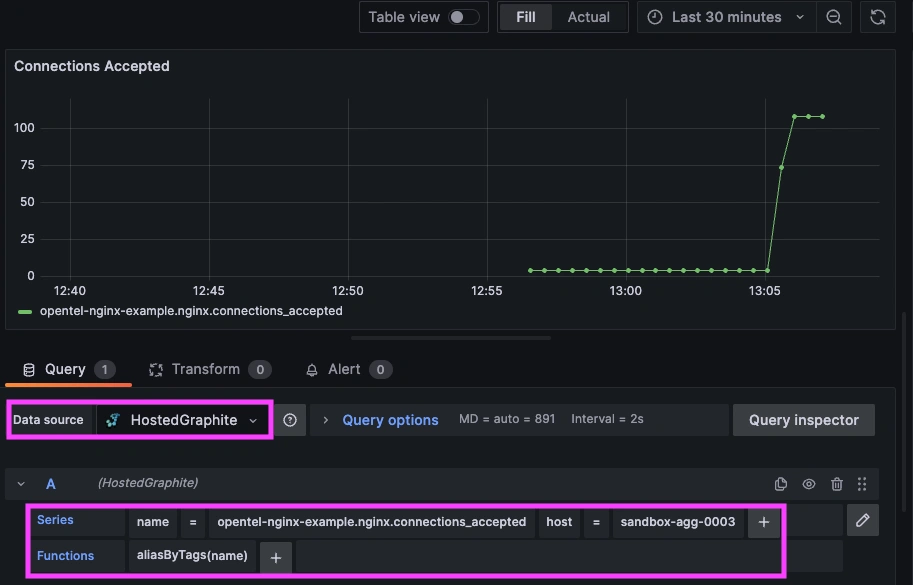
Grafana has many additional options to apply different visualizations, modify the display, set units of measurement, and some more advanced features like configuring dashboard variables and event annotations.
See the Hosted Graphite Dashboard docs for more details around building custom Grafana visualizations.
Creating Graphite Alerts
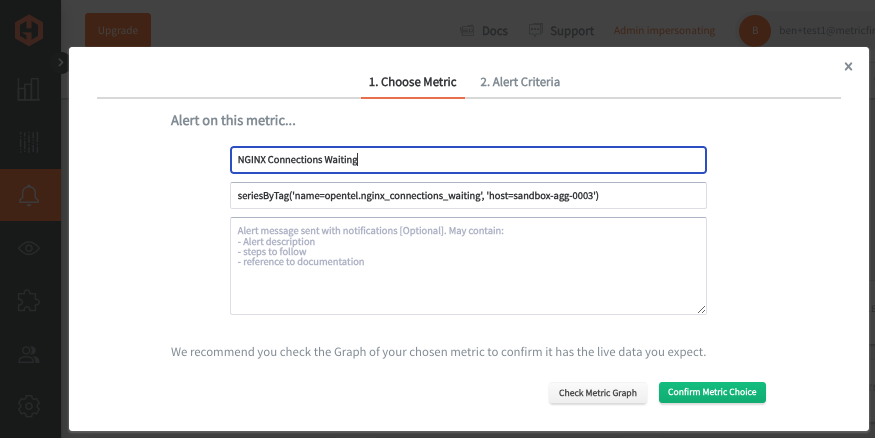
In the Hosted Graphite UI, navigate to Alerts => Graphite Alerts to create a new alert. Name the alert, add your Tagged NGINX Metric to the alerting metric field, and add a description of what this alert is:
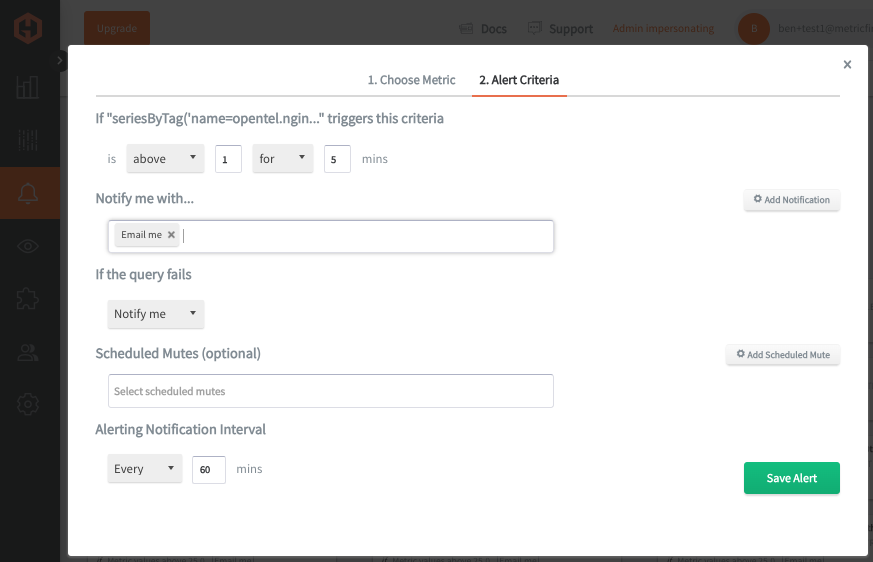
Then, select the Alert Criteria tab to set a threshold and select a notification channel. The default notification channel will be the email you used to sign up for the Hosted Graphite account. Still, you can easily configure channels for Slack, PagerDuty, Microsoft Teams, OpsGenie, custom webhooks and more. See the Hosted Graphite Notification Channels docs for more details:
Conclusion
Tracking NGINX isn’t just about spotting issues—it’s about keeping your app fast, efficient, and rock solid. With OpenTelemetry, you’re not just monitoring NGINX; you’re getting a full view of your entire stack in real time. It connects the dots between traffic spikes, slowdowns, and backend performance, giving you instant insights and making troubleshooting a breeze. By pulling NGINX metrics into OpenTelemetry, you level up your monitoring game, cut through the noise, and keep your infrastructure running like a well-oiled machine.
Also, ensure optimal NGINX performance with OpenTelemetry monitoring; it's important to understand and resolve common server issues—learn how to troubleshoot NGINX 502 Bad Gateway errors caused by PHP-FPM here: Understanding NGINX 502 Bad Gateway: PHP-FPM.
Sign up for the free trial and begin monitoring your infrastructure today. You can also book a demo and talk to the MetricFire team directly about your monitoring needs.