Table of Contents
Great systems are not just built. They are monitored.
MetricFire runs Graphite and Grafana as a fully managed service for growing engineering teams, taking care of storage, scaling, and version updates so your team doesn't have to. Plans start at $19/month, billed per metric namespace rather than per host, and include engineer-staffed support. Integrations work natively with Heroku, AWS, Azure, and GCP, and data is stored with 3× redundancy in SOC2- and ISO:27001-certified data centres.
Introduction
Traefik is a modern reverse proxy and load balancer designed to handle dynamic, microservices-based environments with ease. It's popular for its simple configuration, native integration with cloud platforms, and ability to automatically discover services in real time. Monitoring Traefik is essential to ensure efficient traffic management, gain insights into service performance, and quickly detect issues, making it a vital component in maintaining reliable, high-performance applications.
In this article, we'll detail how to use the Traefik StatsD plugin to forward performance metrics to a Hosted StatsD endpoint.
Getting Started with Hosted Graphite by MetricFire
MetricFire's flagship product, 'Hosted Graphite', is a robust monitoring platform built on open-source versions of Graphite and Grafana.
- If you don't already have an account with MetricFire, you can start a 14 day free trial here.
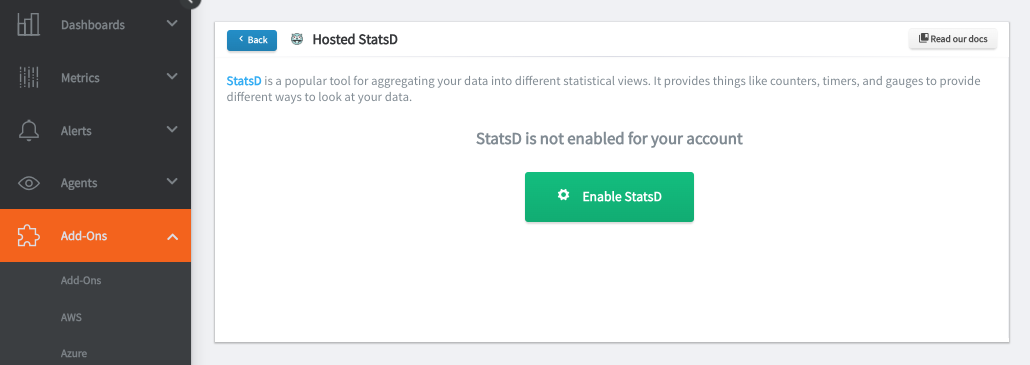
- MetricFire accounts also come with Hosted StatsD, so first you must enable this for your account:
Getting Started with the Traefik
This article assumes that you are already using Traefik in your infrastructure, but below are some simple steps if you want to send example requests to Traefik and forward metrics to MetricFire's Hosted StatsD endpoint.
To get started, you'll need:
- a server (we're using a Linux ubuntu20.04 env for this example)
- a MetricFire account. If you don't already have an account with MetricFire, you can start a 14 day free trial here.
Install and Unpack Traefik
- wget https://github.com/traefik/traefik/releases/download/v3.2.0/traefik_v3.2.0_linux_amd64.tar.gz
- tar -xvzf traefik_v3.2.0_linux_amd64.tar.gz
Move binary to a system-wide location
- mv traefik /usr/local/bin/
- sudo chmod +x /usr/local/bin/traefik
- traefik version
Configure Traefik
- create the traefik config directory: sudo mkdir -p /etc/traefik
- create the traefik.yml configuration file at: /etc/traefik/traefik.yml
- NOTE: the default entry port is :80 but any available port will work
- NOTE: you must add your API key obtained from the MetricFire account
entryPoints:
  web:
    address: ":80"

metrics:
  statsD:
    address: "statsd.hostedgraphite.com:8125"
    prefix: "<YOUR-API-KEY>.traefik"
    addEntryPointsLabels: true
    addRoutersLabels: true
    addServicesLabels: true

providers:
  file:
    filename: "/etc/traefik/dynamic_conf.yml"
- create the dynaminc_conf.yml file at: /etc/traefik/dynamic_conf.yml
http:
  routers:
    my-router:
      rule: "Host(`localhost`)"
      service: my-service

  services:
    my-service:
      loadBalancer:
        servers:
          - url: "http://127.0.0.1:5000"
- create a systemd traefik.service file at: /etc/systemd/system/traefik.service
[Unit]
Description=Traefik Service
After=network.target

[Service]
ExecStart=/usr/local/bin/traefik --configFile=/etc/traefik/traefik.yml
Restart=on-failure

[Install]
WantedBy=multi-user.target
- start/enable traefik systemd service:
- sudo systemctl daemon-reload
- sudo systemctl start traefik
- sudo systemctl enable traefik
- sudo systemctl status traefik
Use a Flask App to Handle Example Requests
- install dependencies:
- sudo apt update
- sudo apt install python3-pip pip3 install flask
- create a simple flask app at: /etc/traefik/app.py
from flask import Flask, request, jsonify

app = Flask(__name__)

@app.route('/', methods=['GET', 'POST'])
def handle_root():
    if request.method == 'GET':
        return jsonify(message="GET request received")
    elif request.method == 'POST':
        return jsonify(message="POST request received")
    return jsonify(message="Unsupported method"), 405

@app.route('/resource', methods=['PUT', 'DELETE'])
def handle_resource():
    if request.method == 'PUT':
        return jsonify(message="PUT request received")
    elif request.method == 'DELETE':
        return jsonify(message="DELETE request received")
    return jsonify(message="Unsupported method"), 405

if __name__ == '__main__':
    app.run(host='127.0.0.1', port=5000)
- launch the Flask development server: python3 app.py
Send Example Requests
Create a simple bash script at: /etc/traefik/send-requests.sh that will send 100 CRUD requests to traefik:
#!/bin/bash

BASE_URL="http://localhost:80"

for i in {1..100}
do
  (
    curl -s -X GET "$BASE_URL" > /dev/null
    curl -s -X POST "$BASE_URL" -d '{"param":"value"}' -H "Content-Type: application/json" > /dev/null
    curl -s -X PUT "$BASE_URL/resource" -d '{"param":"updatedValue"}' -H "Content-Type: application/json" > /dev/null
    curl -s -X DELETE "$BASE_URL/resource" > /dev/null
  )
  sleep 1
done
- Make the script executable and run it:
- sudo chmod +x send-requests.sh
- ./send-requests.sh
See Metrics
After a minute or two, you'll see the following StatsD metrics in your MetricFire account:
counters.traefik.config.reload.total.count
counters.traefik.config.reload.total.rate
counters.traefik.<entrypoint, router, service>.request.total.count
counters.traefik.<entrypoint, router, service>.request.total.rate
counters.traefik.<entrypoint, router, service>.requests.bytes.total.count
counters.traefik.<entrypoint, router, service>.requests.bytes.total.rate
counters.traefik.<entrypoint, router, service>.responses.bytes.total.count
counters.traefik.<entrypoint, router, service>.responses.bytes.total.rate
gauges.traefik.config.reload.lastSuccessTimestamp
gauges.traefik.open.connections
timers.traefik.<entrypoint, router, service>.request.duration.count
timers.traefik.<entrypoint, router, service>.request.duration.count_ps
timers.traefik.<entrypoint, router, service>.request.duration.lower
timers.traefik.<entrypoint, router, service>.request.duration.mean
timers.traefik.<entrypoint, router, service>.request.duration.mean_90
timers.traefik.<entrypoint, router, service>.request.duration.median
timers.traefik.<entrypoint, router, service>.request.duration.std
timers.traefik.<entrypoint, router, service>.request.duration.sum
timers.traefik.<entrypoint, router, service>.request.duration.sum_90
timers.traefik.<entrypoint, router, service>.request.duration.upper
timers.traefik.<entrypoint, router, service>.request.duration.upper_90
Use Your Metrics to Create Custom Dashboards and Alerts
MetricFire is a monitoring platform that enables you to gather, visualize and analyze metrics and data from servers, databases, networks, processes, devices, and applications. Using MetricFire, you can effortlessly identify problems and optimize resources within your infrastructure. Hosted Graphite by MetricFire removes the burden of self-hosting your monitoring solution, allowing you more time and freedom to work on your most important tasks.
Once you have signed up for a Hosted Graphite account and used the above steps to configure your server(s) with the Telegraf Agent, metrics will be forwarded, timestamped, and aggregated into the Hosted Graphite backend.
-
Metrics will be sent and stored in the Graphite format of: metric.name.path <numeric-value> <unix-timestamp>
-
The dot notation format provides a tree-like data structure, making it efficient to query
-
Metrics are stored in your Hosted Graphite account for two years, and you can use them to create custom Alerts and Grafana dashboards.
Build Dashboards in MetricFire's Hosted Grafana
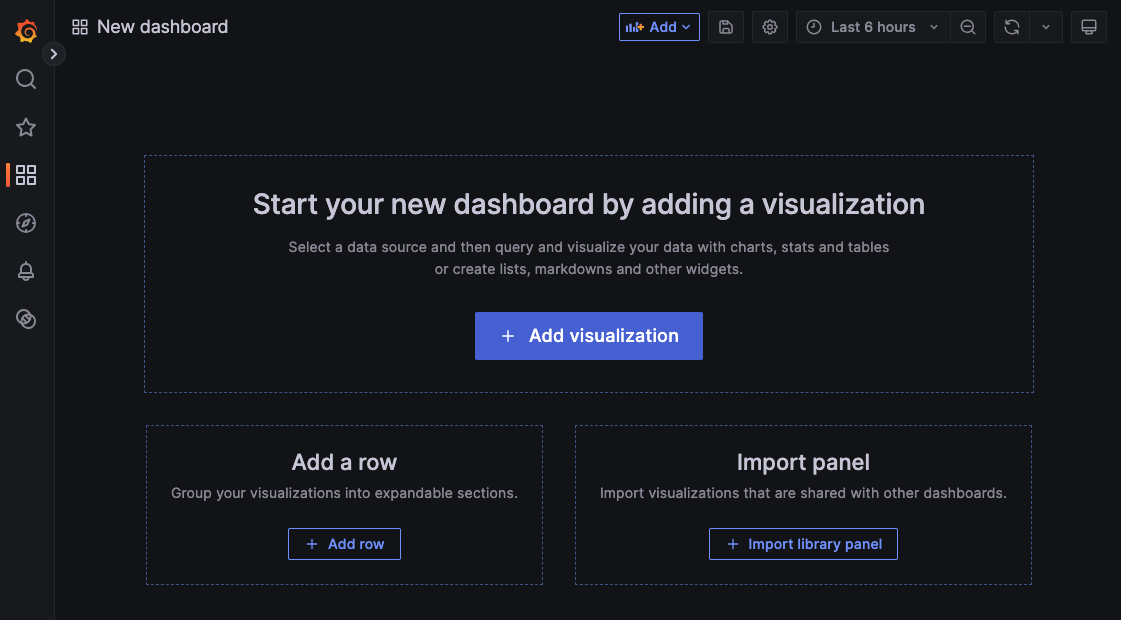
In the Hosted Graphite UI, navigate to Dashboards and select the + button to create a new panel:
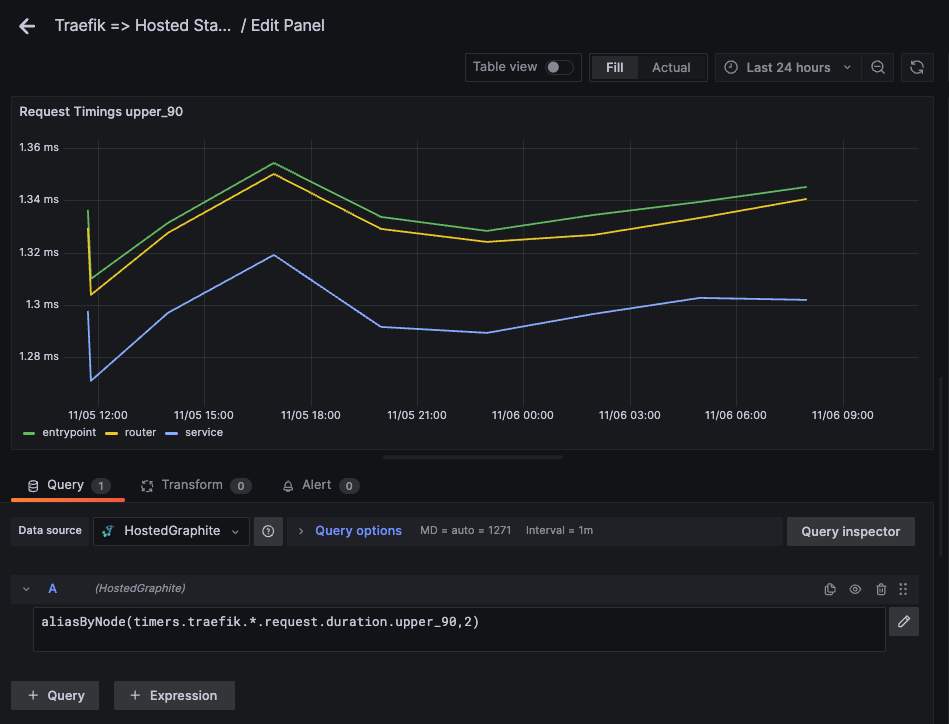
Then you can use Edit mode to query a graphite metric path (the default data source will be the HostedGraphite backend if you are accessing Grafana via your MetricFire account):
NOTE: The HostedGraphite datasource also supports wildcard (*) searching to grab all metrics that match a specified path. The Graphite function aliasByNode() was also applied, to reformat the name.
Additionally, Grafana has many additional options to apply different visualizations, modify the display, set units of measurement, and some more advanced features like configuring dashboard variables and event annotations.
See the Hosted Graphite dashboard docs for more details.
Creating Graphite Alerts
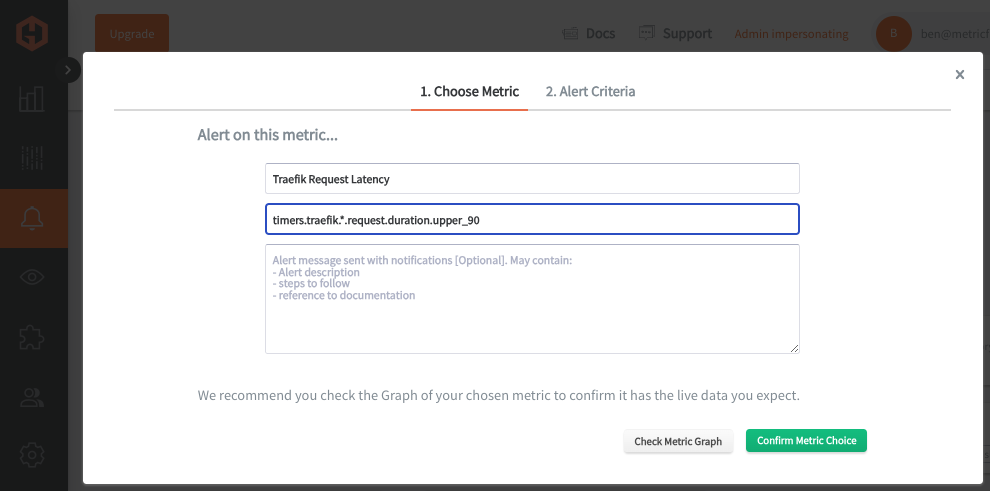
In the Hosted Graphite UI, navigate to Alerts => Graphite Alerts to create a new alert. Name the alert, add a query to the alerting metric field, and add a description of what this alert is:
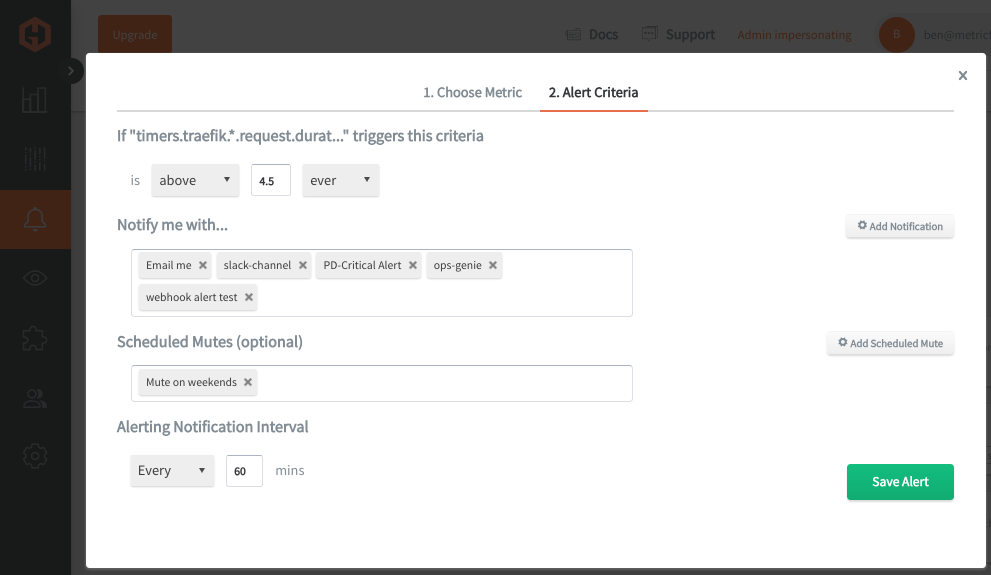
Then, select the Alert Criteria tab to set a threshold and select a notification channel. The default notification channel will be the email you used to sign up for the Hosted Graphite account. Still, you can easily configure channels for Slack, PagerDuty, Microsoft Teams, OpsGenie, custom webhooks and more. See the Hosted Graphite docs for more details on notification channels:
Conclusion
Monitoring and alerting on your Traefik statistics is crucial for keeping your SaaS platform running smoothly and reliably. By staying on top of key metrics, you can quickly catch and resolve issues before they impact users, helping to ensure a seamless experience that keeps customers satisfied and coming back.
Tools like dashboards and alerts will complement your data by providing real-time visualization, proactive identification of issues, historical trend analysis, and facilitating informed decision-making, all essential for maintaining a robust and efficient infrastructure.
Sign up for the free trial and begin monitoring your infrastructure today. You can also book a demo and talk to the MetricFire team directly about your monitoring needs.


