Table of Contents
Great systems are not just built. They are monitored.
MetricFire is the fully managed Graphite and Grafana platform for small teams that don’t want to self-host their monitoring stack. Pre-built dashboards, alerts, and native add-ons for Heroku, AWS, Azure, and GCP. All with dedicated support and no infrastructure to maintain.
Introduction
When you're running a Java application, the JVM is doing a ton of work behind the scenes but unless you're actively collecting its internal metrics, you're essentially flying blind. Fortunately, the JMX Prometheus Receiver paired with the JMX Java Exporter Agent offers one of the simplest and most effective ways to expose JVM performance data. With just a lightweight Java agent and a config file, you can instantly tap into key metrics like memory usage, garbage collection activity, thread counts, and more - all in a format ready for Prometheus or OpenTelemetry. It’s an ideal solution for developers and DevOps teams who want fast visibility into Java applications without the overhead of managing remote JMX access or custom instrumentation.
In this article, we'll explain how to configure the OpenTelemetry Collector to scrape and export Java Application metrics to a public Carbon endpoint.
Install the JMX Prometheus Java Agent
This guide assumes you already have a Java application running but if not, see this similar article which details how to quickly stand up a test Java app (Linux). Once your app is up and running, you can install the Java Agent in your environment.
Installation (ubuntu)
wget https://repo1.maven.org/maven2/io/prometheus/jmx/jmx_prometheus_javaagent/0.20.0/jmx_prometheus_javaagent-0.20.0.jar -O jmx_prometheus_javaagent.jar
Verify the file exists:
ls -lh jmx_prometheus_javaagent.jar
Create a Config File
In this example, we created a config file in our root directory named: jmx_config.yaml
This file is what tells the JMX Prometheus Exporter what to collect and how to expose it. Without it, the exporter wouldn’t know which JVM metrics to grab or how to format them for Prometheus or OpenTelemetry. The rules section acts like a filter, letting you pick the specific JMX beans you care about (memory usage, garbage collection stats, thread counts). Other settings like lowercaseOutputName just help clean up the metric names so they’re easier to work with in dashboards or alerting tools.
startDelaySeconds: 0
ssl: false
lowercaseOutputName: true
lowercaseOutputLabelNames: true
rules:
  - pattern: 'java.lang<type=Memory><>(HeapMemoryUsage|NonHeapMemoryUsage)'
  - pattern: 'java.lang<type=GarbageCollector,name=(.+)><>CollectionCount'
  - pattern: 'java.lang<type=GarbageCollector,name=(.+)><>CollectionTime'
  - pattern: 'java.lang<type=Threading><>ThreadCount'
Run Your Java App
You can run your app on the default port :8080 but if that port is already taken by another process, you can change it to any available port:
java \
  -Djava.net.preferIPv4Stack=true \
  -javaagent:./jmx_prometheus_javaagent.jar=8080:./jmx_config.yaml \
  -jar JMXTestApplication.jar
Confirm the Metric Output
In another terminal window within your server, confirm that metrics are indeed being exposed at the defined endpoint:
curl http://localhost:8080/metrics
Now you can install OpenTelemetry and run it in order to collect/forward the metrics from your Java application.
Install and Configure OpenTelemetry
OpenTelemetry as a Collector has built-in support for NGINX, PostgreSQL, Redis, RabbitMQ, Kubernetes, Elasticsearch, Prometheus, and many more! These Receivers pull key performance metrics directly from your services—no manual parsing or custom scripts needed. This article assumes you already use OpenTelemetry, but below are examples of how to install and configure otelcol-contrib to quickly collect system metrics and export them to a Carbon endpoint.
Install OpenTelemetry Collector Contrib (Linux)
/etc/otelcol-contrib/Ubuntu/Debian (AMD)
wget https://github.com/open-telemetry/opentelemetry-collector-releases/releases/download/v0.119.0/otelcol-contrib_0.119.0_linux_amd64.deb

sudo dpkg -i otelcol-contrib_0.119.0_linux_amd64.deb
RedHat/CentOS (AMD)
wget https://github.com/open-telemetry/opentelemetry-collector-releases/releases/download/v0.119.0/otelcol-contrib_0.119.0_linux_amd64.rpm

sudo rpm -ivh otelcol-contrib_0.119.0_linux_amd64.rpm
Confirm the Installation
otelcol-contrib --version
Configure the Prometheus Receiver and Carbon Exporter
The Prometheus Receiver in OpenTelemetry collects metrics from localhost:8080, processes them, and forwards them to your exporter of choice. NOTE: in this example, we're naming it prometheus/jmx simply to clarify that this instance of the Prometheus Receiver is specifically scraping metrics from the JMX exporter.
The Carbon Exporter takes those metrics and ships them straight to Graphite-compatible backends, making it easy to integrate OpenTelemetry with minimal setup.
If you're not currently hosting your own Graphite data source, start a 14-day free trial with Hosted Graphite by MetricFire to continue following along with this example. A MetricFire account will provide the Graphite data source and include Hosted Grafana as a visualization tool - along with Alerting, Integrations, and Team features.
- First, find the OTel configuration file generally located at: /etc/otelcol-contrib/config.yaml and open it in your preferred text editor.
- Then you can either replace the file, or add the following sections to your current config.
- Be sure to include your HG-API-KEY and HOSTNAME.
receivers:
  prometheus/jmx:
    config:
      scrape_configs:
        - job_name: 'jmx-app'
          static_configs:
            - targets: ['localhost:8080']

processors:
  batch: {}
  metricstransform:
    transforms:
      - include: ".*"
        match_type: regexp
        action: update
        new_name: "<HG-API-KEY>.opentel.$$0"
        operations:
          - action: add_label
            new_label: host
            new_value: <HOSTNAME>

exporters:
  carbon:
    endpoint: "carbon.hostedgraphite.com:2003"
    timeout: 10s

service:
  pipelines:
    metrics:
      receivers:
        - prometheus/jmx
      processors:
        - batch
        - metricstransform
      exporters:
        - carbon
Now, just save the file and restart the otelcol-contrib service:
sudo systemctl restart otelcol-contrib
sudo systemctl status otelcol-contrib
Or you can server the file manually - to troubleshoot potential configuration errors:
otelcol-contrib --config /etc/otelcol-contrib/config.yaml
Ship Tagged Graphite Metrics
Within two minutes of restarting the otelcol-contrib service, a set of Tagged Graphite metrics will be forwarded to your Hosted Graphite account (with the opentel.jvm* prefix).
Why does OpenTelemetry export Tagged metrics to Carbon?
- Because it's core model aligns more with Prometheus-style 'labels' than Graphite's 'dot notation' formatting. Instead of flattening data into long metric names, it preserves the labels by using Graphite tags, which enables richer filtering in your Graphite backend.
Now you can locate these Tagged Metrics in the Hosted Graphite Tag Search UI - under the host tag:

Otherwise, you can configure a different exporter to forward metrics to another data source.
JMX Receiver VS Prometheus Receiver
Both the OpenTelemetry's JMX Receiver and Prometheus Receiver (using the jmx_exporter agent) can collect JVM metrics - but the experience can be slightly different for each. The JMX Receiver requires you to open a remote JMX port, deal with extra JVM flags, and install the opentelemetry-jmx-metrics.jar. It works, but setup can feel clunky and you might hit permission or connectivity issues, especially in secured or containerized environments. See our related blog article HERE if you're interested in learning more about configuring the OTel JMX Receiver to monitor your Java app.
On the flip side, the Prometheus approach is pretty lightweight. As detailed in this article, you just drop the jmx_exporter agent into your startup command, point it to a config file, and you're done - with no extra ports and no separate jars to worry about. So if you need a quick, clean, and production-friendly way to monitor Java apps, the Prometheus Receiver + Java agent combo is often the smoother path. In our testing, the Prometheus/JMX configuration also produced more metrics than the JMX Receiver, giving us additional insight into our app's performance.
Use Hosted Graphite by MetricFire to Create Custom Dashboards and Alerts
MetricFire is a monitoring platform that enables you to gather, visualize and analyze metrics and data from servers, databases, networks, processes, devices, and applications. Using MetricFire, you can effortlessly identify problems and optimize resources within your infrastructure. Hosted Graphite by MetricFire removes the burden of self-hosting your monitoring solution, allowing you more time and freedom to work on your most important tasks.
Metrics sent to the public carbon endpoint will be timestamped, and aggregated into the Hosted Graphite backend.
-
OpenTelemetry metrics will be sent and stored in the Graphite Tag format of: my.series;tag1=value1;tag2=value2 metric_value (timestamp)
-
The tags provide a filtering option, making the metrics efficient to query
-
Metrics are stored in your Hosted Graphite account for two years, and you can use them to create custom Dashboards and Alerts.
Build Custom Dashboards in MetricFire's Hosted Grafana
In the Hosted Graphite UI, navigate to Dashboards and select + New Dashboard to create a new visualization.
Then go into Edit mode and use the Query UI to select a graphite metric path (the default data source will be HostedGraphite if you are accessing Grafana via your HG account).
NOTE: To query Tagged metrics, you must apply the seriesByTag Graphite function - the alias() function is optional but makes your metric names more readable on the graph.
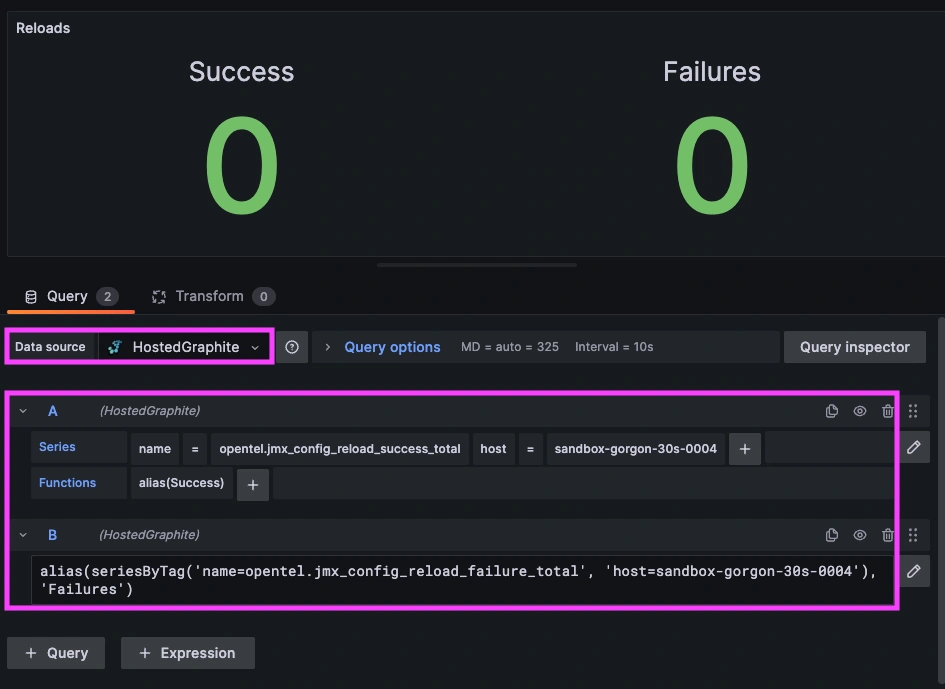
Grafana has many additional options to apply different visualizations, modify the display, set units of measurement, and some more advanced features like configuring dashboard variables and event annotations.
Here's an example of a production dashboard that was built using Prometheus/JMX Receiver => Graphite metrics:
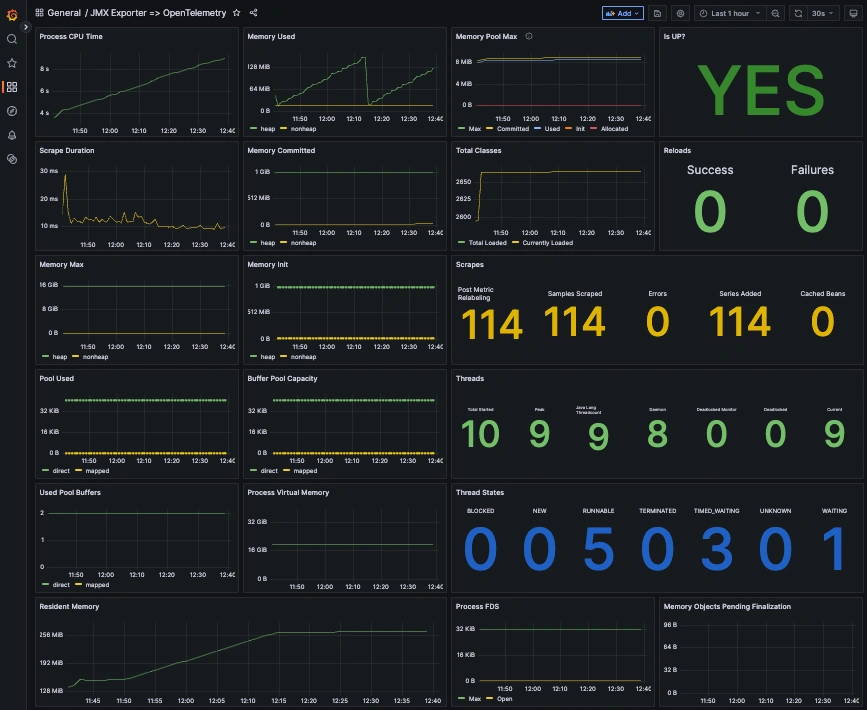
See the Hosted Graphite Dashboard docs for more details around building custom Grafana visualizations.
Creating Graphite Alerts
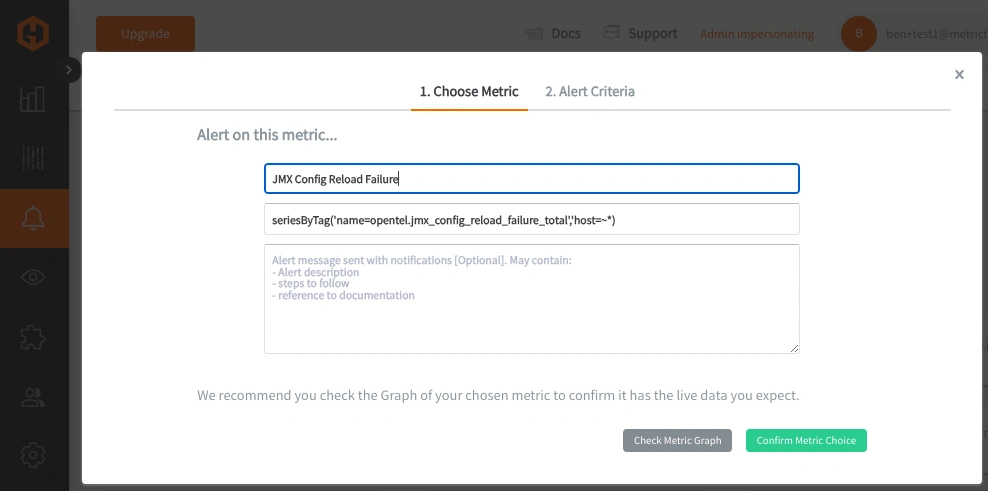
In the Hosted Graphite UI, navigate to Alerts => Graphite Alerts to create a new alert. Name the alert, add your Tagged JVM Metric to the alerting metric field, and add a description of what this alert is:
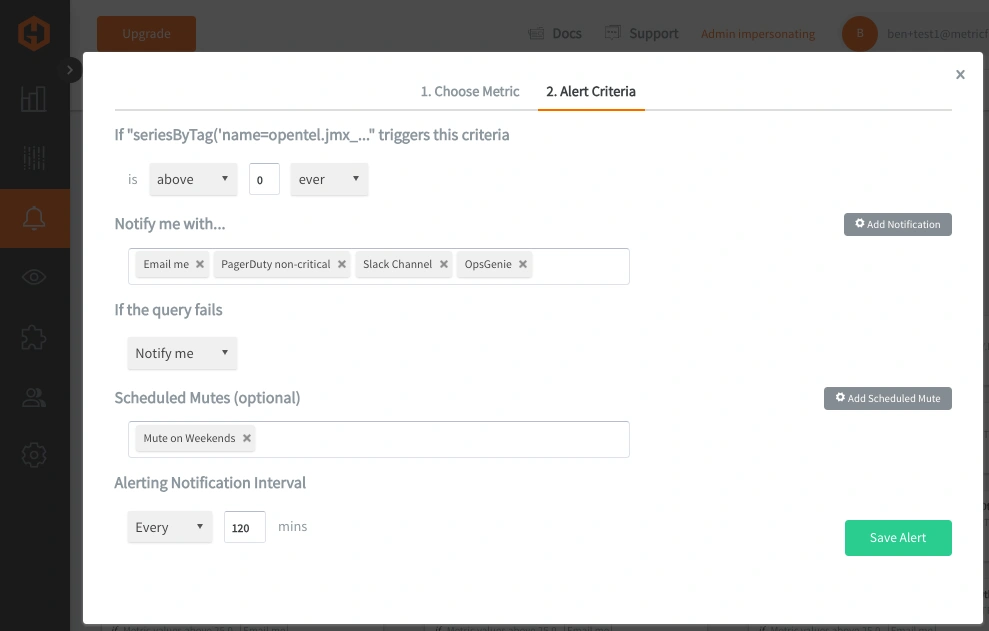
Then, select the Alert Criteria tab to set a threshold and select a notification channel. The default notification channel will be the email you used to sign up for the Hosted Graphite account. Still, you can easily configure channels for Slack, PagerDuty, Microsoft Teams, OpsGenie, custom webhooks and more. See the Hosted Graphite Notification Channels docs for more details:
Conclusion
Monitoring your Java application is critical for maintaining performance user trust, especially as your system scales or customer demand grows. JVM metrics like heap memory usage, thread activity, and garbage collection behavior provide deep visibility into how your app is handling load, managing resources, and recovering from stress. With real-time monitoring in place, teams can proactively detect issues, optimize performance, and prevent outages before they impact users or revenue.
Sign up for the free trial and begin monitoring your infrastructure today. You can also book a demo and talk to the MetricFire team directly about your monitoring needs.