Table of Contents
Introduction
Monitoring K8s is crucial to ensure that your applications run smoothly. But before you look for a monitoring solution, you need to ask what tools are the best for your situation. There are several options, but Graphite and Prometheus are two leading options. This article will compare the two.
To read more about monitoring k8s, click here.
K8s Summary
K8s is software used by developers to deploy and manage applications. It provides APIs for managing application deployments and isolates networks for each application to ensure secure communication.
Why You Should Monitor K8s
Monitoring K8s lets you understand what is happening with your applications and deployments.
Often, small teams use tools like K8s without a monitoring solution because they can handle the small amount of data or think command-line tools such as K9s will work for their use case. But as their businesses grow, so does their data. Many small teams migrate to a hosted solution because their limited resources prohibit the insight they need.
In the following sections, we will compare Graphite and Prometheus.
What Is Prometheus?
Prometheus has a broader set of functionality, so users don't need to install various plugins or daemons to get the service up and running.
Pros
Using Prometheus with Kubernetes and Docker is more common than with Graphite because there is broad community support for Prometheus monitoring of Kubernetes and Docker. Check out our video tutorial on deploying Prometheus to Kubernetes for more information.
With our support team's assistance, you can use the Telegraf plugin with Hosted Graphite just as easily. Read this blog to learn more about using k8s with MetricFire!
Cons
Although Prometheus is scalable, engineers face a common problem: the need for long-term data storage. Open-source Prometheus only stores data for up to 14 days, making record-keeping and forecasting with your data very difficult. Hosted Graphite by MetricFire offers two years of long-term storage and is just as scalable, so you can easily monitor your K8s and Docker containers and have historical data.
How It Works
Prometheus pulls data from the clients, so there's no need for StatsD or collected data to push to the server. However, this causes challenges, especially when the client doesn't have data for Prometheus to pull.
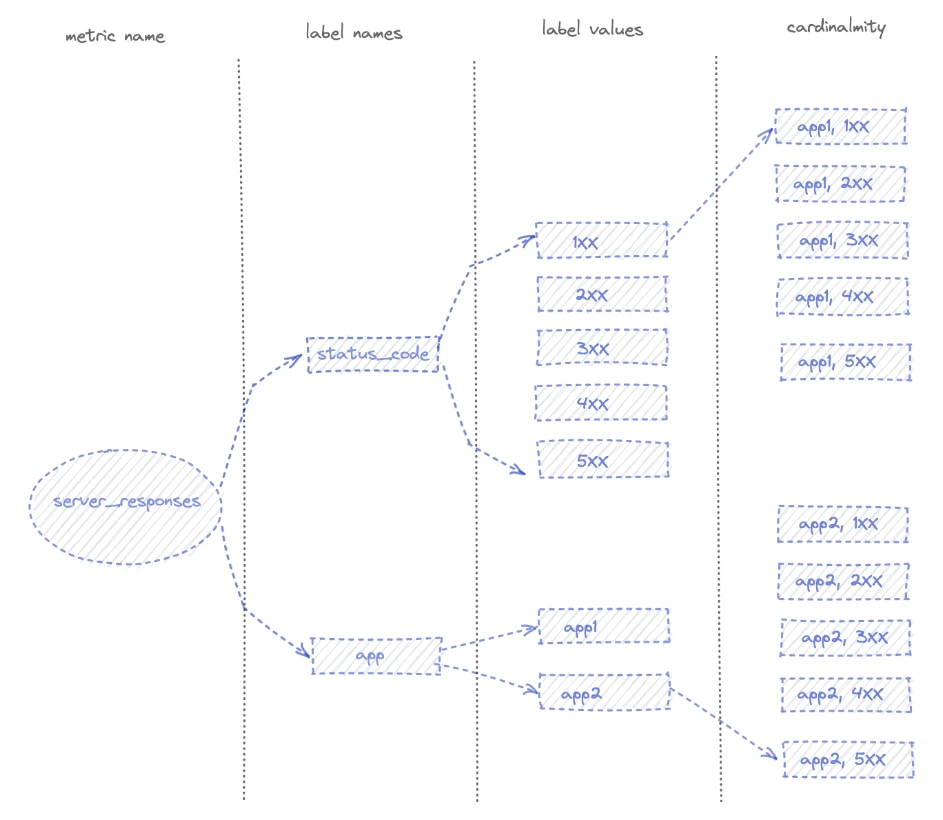
Each Prometheus metric is recorded with a label so users can break metrics into groups and subgroups to look at different data sets.
For more information about Prometheus metric structure, check out our article, Prometheus Monitoring 101.
What Is Graphite?
Graphite is an open-source enterprise-ready time-series database. It helps you store, query, and visualize your time-series data points from anywhere and everywhere—be it any website, system, device, server, or all of them together at the same time—absolutely FREE of charge.
Graphite has high performance, simple architecture, and easy-to-use features. It doesn't have a challenging learning curve and can be managed with a basic skill set. It also has a huge community of active developers that quickly respond to any issues/fixes or general queries.
Pros
Graphite has a hierarchical metric naming scheme, making querying Graphite metrics easier than Prometheus metrics. For example, when querying application response time in Graphite, a typical metric would look like "app.server1.response_time"
With Prometheus, the same query would look something similar to "response_time{app= "app", server= "server1"}"
Prometheus' label-based system is complex, and it can be challenging to learn how to use it for any team, no matter the resources they have available.
Graphite's naming scheme is much simpler. There is no need for labels or custom filters; Graphite can easily filter based on your metric segments.
Cons
Graphite is a lot older than Prometheus and less fancy. But while some view that as a negative, we prefer Graphite because it is tried and true!
Open-source Prometheus has more plugins built in than open-source Graphite, such as Kubernetes. Luckily, we have an alternative: Hosted Graphite!
How It Works
Graphite provides a comprehensive library of statistical and transformative rendering functions capable of manipulating series data streams into critical gauges of system activity. One of the most prominent features of Graphites renders API is the ability to chain functions together, allowing engineers to compose deep levels of granularity.
As each series on a chart is associated with a data stream, it is possible to pipe the output of one processing function into the next, combining the piped and nested functions. See the example below:
sumSeries(stats_global.production.counters.api.requests.*.count)|scaleToSeco nds(60)|movingAverage(30)|alias('api.avg')
There are always cases when a custom function is necessary; every production system has quirks and anomalies. It is possible to add custom processing functions to the Graphite API. Custom functions are packaged as Python modules and are loaded by Graphite when placed in the /opt/graphite/webapp/graphite/functions/custom folder. More information on writing and using custom functions is available here.
The following is a simple example of replacing underscores in Metric Names:
from Graphite.functions.params import Param, ParamTypes


def  formatHostLegend(requestContext, seriesList):

        """Custom function that prints a pretty-fied legend name"""

        for series in seriesList:

                pos = series.name.find(".perfdata")

                first = series.name[0:pos]

                second = series.name[pos:]


                series.name = first.replace('_', '.') + second


        return series list


# Define group

formatHostLegend.group = 'Custom'


# Define parameters for the callback

formatHostLegend.params = [

        Param('seriesList', ParamTypes.seriesList, required=True)

]


# Register the callback function

SeriesFunctions = {

        'formathostlegend': formatHostLegend

}
Getting Started With MetricFire
Getting started with MetricFire is easy! Sign up for a free cardless trial and reach out to our support! We can walk you through how to send your first metrics.
If you have questions about monitoring, we'd love to talk with you. Contact us on LinkedIn, Twitter, or Facebook, or book a call!
Conclusion
In this blog, we covered Graphite and prometheus and briefly discussed how you can use each to monitor K8s. To learn more about monitoring K8s, click here!