Table of Contents
Great systems are not just built. They are monitored.
MetricFire is the fully managed Graphite and Grafana platform for small teams that don’t want to self-host their monitoring stack. Pre-built dashboards, alerts, and native add-ons for Heroku, AWS, Azure, and GCP. All with dedicated support and no infrastructure to maintain.
Introduction
Having insights into your Kubernetes environment is crucial for ensuring optimal resource allocation and preventing potential performance bottlenecks. It also enables proactive monitoring of application health and security, helping to quickly identify and resolve issues before they impact users. In addition to the Telegraf Kubernetes plugin, the kube_inventory plugin provides valuable metadata about Kubernetes resources, such as pods, nodes, and services, giving deeper visibility into the state of your cluster. By integrating these stats with your other K8 performance metrics, you can better correlate infrastructure changes with application behavior, enabling more comprehensive monitoring and troubleshooting.
Prerequisites
As outlined in our related article around configuring a Telegraf Daemonset with your K8 clusters, you will need to set your context using the kubectl command line tool.
- kubectl config get-contexts
- kubectl config use-context <context-name>
Creating the Telegraf Daemonset File Structure
You can refer to our detailed article around configuring a Telegraf Daemonset, but all you really need to do is clone the public metricfire/telegraf-daemonset repository:
In addition to the pre-configured inputs.kubernetes plugin defined on the config.yaml file, we will show you how to add a few things to your manifest to also collect inventory stats.
Project Directory:
telegraf-daemonset/
├── kustomization.yaml
└── resources/
    ├── config.yaml
    ├── daemonset.yaml
    ├── namespace.yaml
    ├── role.yaml
    ├── role-binding.yaml
    └── service_account.yaml
First, you will add the following block to your resources/config.yaml file:
[[inputs.kube_inventory]]
      namespace = ""
Next, you will add the following section to your role.yaml file, as outlined in the official GitHub kube_inventory Telegraf plugin docs:
---
kind: ClusterRole
apiVersion: rbac.authorization.k8s.io/v1
metadata:
  name: influx:cluster:viewer
  labels:
    rbac.authorization.k8s.io/aggregate-view-telegraf: "true"
rules:
  - apiGroups: [""]
    resources: ["persistentvolumes", "nodes"]
    verbs: ["get", "list"]

---
kind: ClusterRole
apiVersion: rbac.authorization.k8s.io/v1
metadata:
  name: influx:telegraf
aggregationRule:
  clusterRoleSelectors:
    - matchLabels:
        rbac.authorization.k8s.io/aggregate-view-telegraf: "true"
    - matchLabels:
        rbac.authorization.k8s.io/aggregate-to-view: "true"
rules: [] # Rules are automatically filled in by the controller manager.
Finally, you will add the following section to your role-binding.yaml file:
---
apiVersion: rbac.authorization.k8s.io/v1
kind: ClusterRoleBinding
metadata:
  name: influx:telegraf:viewer
roleRef:
  apiGroup: rbac.authorization.k8s.io
  kind: ClusterRole
  name: influx:telegraf
subjects:
  - kind: ServiceAccount
    name: telegraf
    namespace: default
Deploying the Telegraf Daemonset
At this point in your project directory, you should have the kustomization.yaml file and the resources directory (containing the other 6 yaml files).
Since you should already be using the correct cluster context, you can test (dry run) and then deploy the kustomization.yaml file from within your root project directory:
- kubectl apply -k . --dry-run=client
- kubectl apply -k .
Expected output:
namespace/monitoring configured
serviceaccount/telegraf-sa configured
clusterrole.rbac.authorization.k8s.io/influx:cluster:viewer configured
clusterrole.rbac.authorization.k8s.io/influx:telegraf configured
clusterrole.rbac.authorization.k8s.io/telegraf-cluster-role configured
clusterrolebinding.rbac.authorization.k8s.io/influx:telegraf:viewer configured
clusterrolebinding.rbac.authorization.k8s.io/telegraf-sa-binding configured
configmap/telegraf-config configured
daemonset.apps/telegraf-inventory created
You can now get a list of running daemonsets in your cluster and see one with the Name telegraf and a Namespace of monitoring:
- kubectl get daemonsets --all-namespaces
Telegraf will now be collecting/forwarding metrics from both the inputs.kubernetes, and inputs.kube_inventory plugins.
Since this article details the kube_inventory plugin, you can look for the following metric patterns in your HG account - which are coming specifically from the kube_inventory Telegraf plugin:
["persistentvolumes", "nodes", "daemonsets", "deployments", "endpoints", "persistentvolumeclaims", "services", "statefulsets", "resourcequotas"]
These metrics will be in the Graphite format and can be used in HG to create custom dashboards and alerts. See the official GitHub repository for additional details and configuration options for the inputs.kube_inventory plugin.
Use Your Graphite Metrics to Create Dashboards and Alerts
Navigate to your Hosted Graphite trial account => Metrics Search. When using the metricfire/telegraf-daemonset your metrics will be prefixed with telegraf-k8, however in this example these metrics are simply prefixed with: sandbox.<node-id>
example of node status_condition metrics returned:

sandbox.<node-id>.DiskPressure.<node-id>.False.<k8-version>.kubernetes_node.status_condition
sandbox.<node-id>.MemoryPressure.<node-id>.False.<k8-version>.kubernetes_node.status_condition
sandbox.l<node-id>.NetworkUnavailable.<node-id>.False.<k8-version>.kubernetes_node.status_condition
sandbox.<node-id>.PIDPressure.<node-id>.False.<k8-version>.kubernetes_node.status_condition
sandbox.<node-id>.Ready.<node-id>.True.<k8-version>.kubernetes_node.status_condition
Then you can navigate to Dashboards to create a new Grafana visualization using the Graphite metrics from your list:
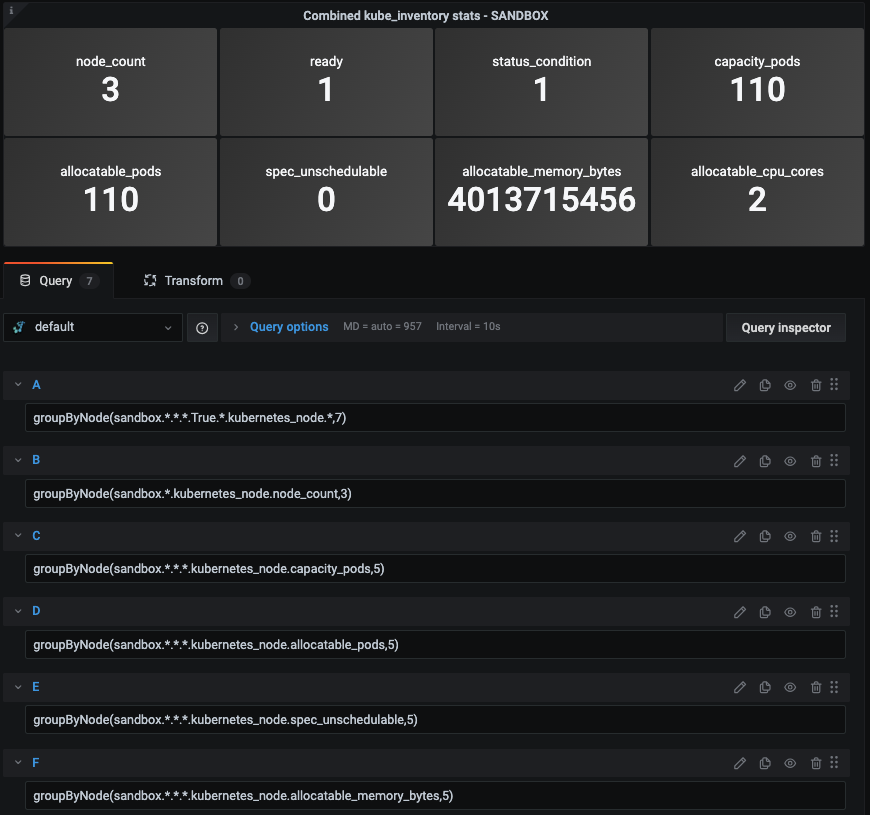
Since the plugin returns multiple stats from each K8 node, you can use Graphite functions like groupByNode() to combine all metrics at a certain index in the series, and average them.
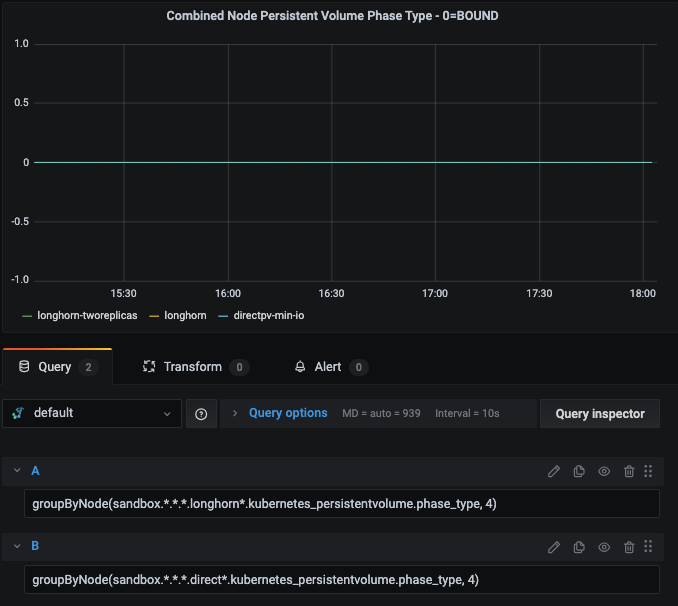
Here's are some additional queries from the returned persistentvolume metrics:
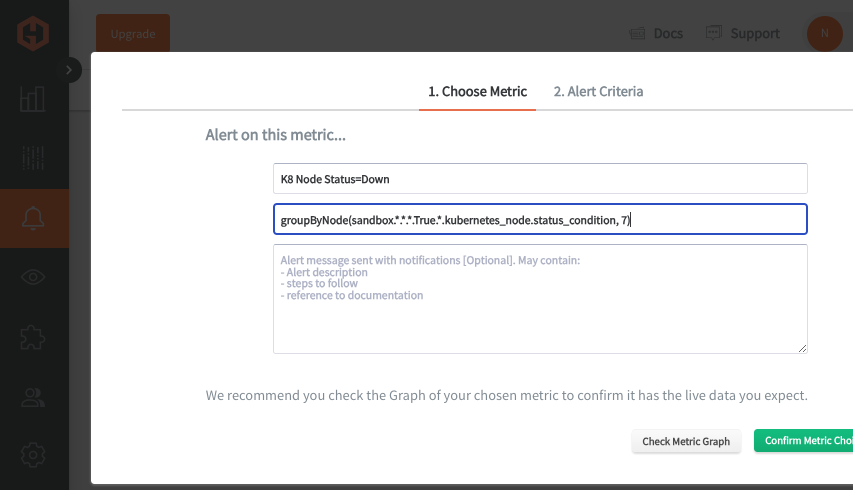
You can also use these Graphite metrics to create custom alerts that will notify you via Slack, PagerDuty, MSTeams, OpsGenie, etc.
In the Hosted Graphite UI, just navigate to Graphite Alerts => Add Alert, then name the alert and add an alerting metric:
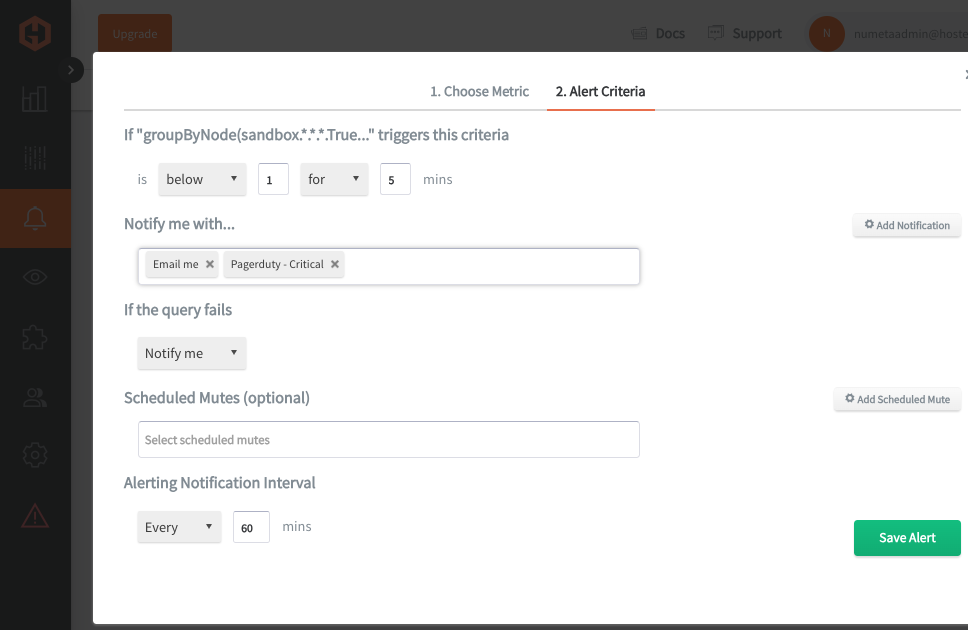
Then set the alert criteria, in this example if the node status changes from 1 => 0, I want to receive a notification:
Conclusion
Monitoring your Kubernetes clusters is key to keeping your applications healthy, stable, and performing well. It helps you catch issues like resource shortages or failed deployments early, so you can fix them before they cause bigger problems. Storing time-series data from your metrics allows you to spot long-term trends, like changes in resource usage or recurring issues, which is super helpful for planning and optimizing your infrastructure. Having that historical data lets you make smarter decisions, track improvements, and anticipate future needs.
Pairing time-series data with tools like dashboards and alerts gives you real-time visibility into key metrics and helps you visualize trends in an easy-to-digest way. Alerts ensure you’re immediately notified of critical issues, while dashboards allow for deeper analysis, making it easier to understand the context behind performance changes and take action quickly.
Sign up here for a free trial of our Hosted Graphite and Grafana services. If you have any questions about our products or about how MetricFire can help your company, book a demo and talk to us directly.