Table of Contents
Great systems are not just built. They are monitored.
MetricFire runs Graphite and Grafana as a fully managed service for small engineering teams, taking care of storage, scaling, and version updates so your team doesn't have to. Plans start at $19/month, billed per metric namespace rather than per host, and include engineer-staffed support. Integrations work natively with Heroku, AWS, Azure, and GCP, and data is stored with 3× redundancy in SOC2- and ISO:27001-certified data centres.
Introduction
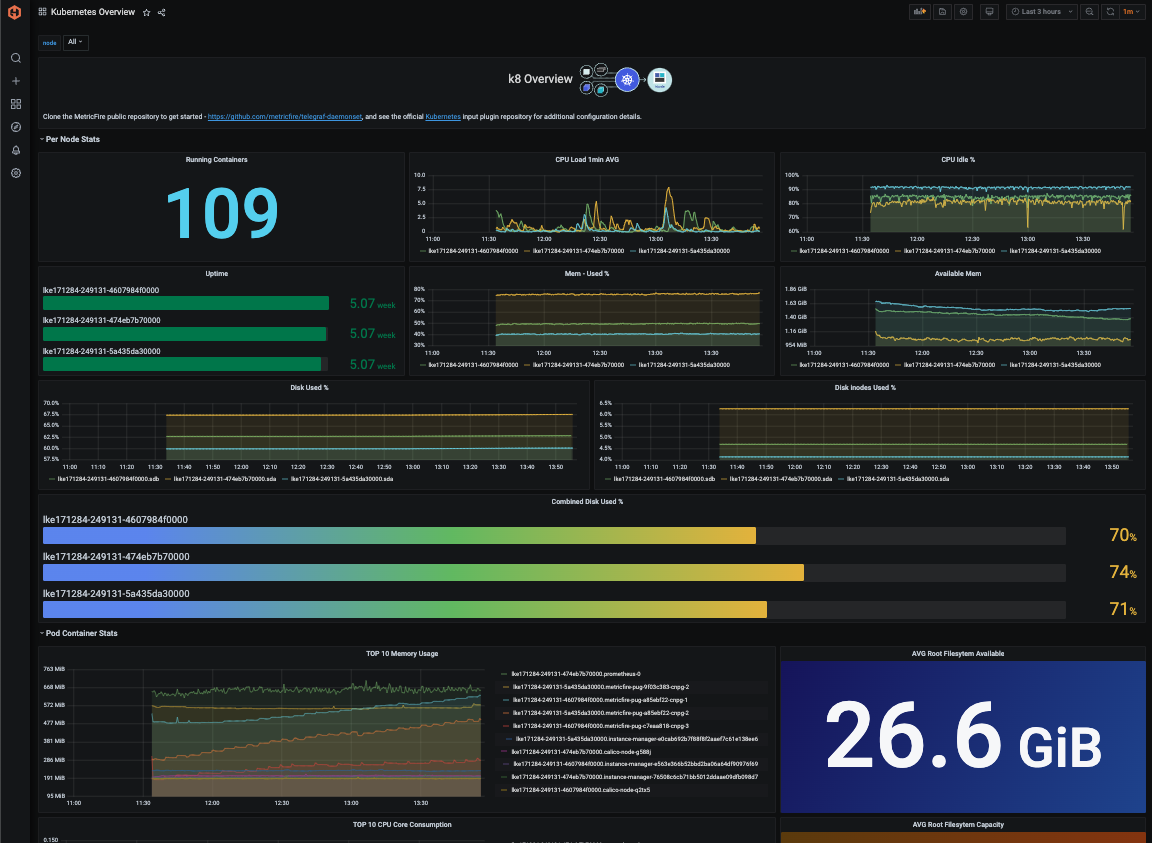
By following this tutorial, you will be able to easily monitor a Kubernetes cluster using the Telegraf agent as a Daemonset that forwards node/pod metrics to a data source and uses that data to create custom dashboards and alerts. Check out what we were able to achieve in just a few minutes:
Kubernetes is used in production-level applications and software services to automate containerised applications' deployment, scaling, and management - ensuring high availability and consistent performance across distributed systems. It enhances reliability through load balancing, self-healing, and rolling updates, enabling efficient resource utilization and orchestration in cloud-native and hybrid environments. It has grown in popularity recently and is a valuable platform for managing software infrastructures worldwide.
Monitoring your Kubernetes clusters is crucial for optimizing resource usage and ensuring application performance by detecting issues early and enabling quick resolutions. It enhances security by providing visibility into anomalous activities and helps in compliance with regulatory standards. Additionally, monitoring aids in cost management and capacity planning, ensuring the reliability and availability of services in dynamic environments.
Prerequisites
This article assumes that you have access to an active Kubernetes cluster. If not, you can spin up a test cluster using tools like minikube via Docker Desktop or even a managed service like AWS EKS or Linode. In this example, we are collecting metrics from a cluster hosted in Linode.
Next, you will also need a data source to forward metrics to. For a free and easy data source configuration, you can sign up for a MetricFire trial, which offers Hosted Graphite and Grafana services. Once you have signed up for a trial account, you will be given an API key that you can use in the next steps listed below.
Finally, you will deploy Telegraf as a Daemonset into your cluster. This means you must have the kubectl tool installed on your command line and your ~/.kube/config file properly configured with your cluster context and credentials (certificate-authority-data, token).
Once the k8 cluster is running, and your ~/.kube/config file is configured to allow CLI access, you can set your context:
- kubectl config get-contexts
- kubectl config use-context <context-name>
Creating the Telegraf Daemonset File Structure
Daemonset deployments are generally managed by a configuration of YAML files, and using Helm charts is popular because they offer an easy way to create these files automatically - like a framework boilerplate. However, if the complexity of a Helm chart is not required, the Kustomize tool can be an excellent option for managing deployments because it's already built into kubectl. Below, we will detail a basic file structure for deploying the Telegraf agent as a daemonset using the Kustomize command line tool. You can manually create each directory/file on your local machine or simply clone our public repository from the MetricFire GitHub.
Project Directory:
telegraf-daemonset/
├── kustomization.yaml
└── resources/
    ├── config.yaml
    ├── daemonset.yaml
    ├── namespace.yaml
    ├── role.yaml
    ├── role-binding.yaml
    └── service_account.yaml
kustomization.yaml: This file serves as the orchestrator, tying together all the other YAML files and applying any additional configurations or patches. It ensures that the deployment is consistent and repeatable across environments.
apiVersion: kustomize.config.k8s.io/v1beta1
kind: Kustomization

namespace: monitoring

resources:
  - resources/config.yaml
  - resources/daemonset.yaml
  - resources/namespace.yaml
  - resources/role-binding.yaml
  - resources/role.yaml
  - resources/service_account.yaml
resources/config.yaml: This file contains the configuration data that your DaemonSet or any Kubernetes resource might need. For Telegraf, it would typically include input/output plugins, and their configurations. It is used as a ConfigMap in Kubernetes to provide configuration data to your DaemonSet. In addition to the 'default' performance collection plugins, we will be configuring the inputs.kubernetes plugin, and the outputs.graphite plugin, which will forward data to your Hosted Graphite trial account (make sure to add your HG API key to this file).
apiVersion: v1
kind: ConfigMap
metadata:
  name: telegraf-config
data:
  telegraf.conf: |
    [agent]
      hostname = "$HOSTNAME"
      interval = "10s"
      round_interval = true

    [[inputs.cpu]]
      percpu = false  ## setting to 'false' limits the number of cpu metrics returned

    [[inputs.disk]]
      ignore_fs = ["tmpfs", "devtmpfs", "devfs", "iso9660", "overlay", "aufs", "squashfs"]

    # [[inputs.diskio]]  ## commented out to limit the number of metrics returned

    [[inputs.mem]]

    [[inputs.system]]

    [[outputs.graphite]]
      servers = ["carbon.hostedgraphite.com:2003"]
      prefix = "<YOUR-HG-API-KEY>.telegraf-k8"

    [[inputs.kubernetes]]
      url = "https://$HOSTIP:10250"
      bearer_token = "/var/run/secrets/kubernetes.io/serviceaccount/token"
      insecure_skip_verify = true
resources/daemonset.yaml: This file defines the DaemonSet resource for Kubernetes. A DaemonSet ensures that a copy of a Pod runs on all (or some) nodes in the cluster. It contains specifications for the Pod template, such as the container image, resource limits, and volumes.
apiVersion: apps/v1
kind: DaemonSet
metadata:
  name: telegraf
spec:
  selector:
    matchLabels:
      name: telegraf
  template:
    metadata:
      labels:
        name: telegraf
    spec:
      serviceAccountName: telegraf-sa
      containers:
      - name: telegraf
        image: telegraf:latest
        resources:
          limits:
            memory: 200Mi
            cpu: 200m
          requests:
            memory: 100Mi
            cpu: 100m
        volumeMounts:
        - name: config
          mountPath: /etc/telegraf/telegraf.conf
          subPath: telegraf.conf
        - name: docker-socket
          mountPath: /var/run/docker.sock
        - name: varlibdockercontainers
          mountPath: /var/lib/docker/containers
          readOnly: true
        - name: hostfsro
          mountPath: /hostfs
          readOnly: true
        env:
        # This pulls HOSTNAME from the node, not the pod.
        - name: HOSTNAME
          valueFrom:
            fieldRef:
              fieldPath: spec.nodeName
        # In test clusters where hostnames are resolved in /etc/hosts on each node,
        # the HOSTNAME is not resolvable from inside containers
        # So inject the host IP as well
        - name: HOSTIP
          valueFrom:
            fieldRef:
              fieldPath: status.hostIP
        # Mount the host filesystem and set the appropriate env variables.
        # ref: https://github.com/influxdata/telegraf/blob/master/docs/FAQ.md
        # HOST_PROC is required by the cpu, disk, mem, input plugins
        - name: "HOST_PROC"
          value: "/hostfs/proc"
        # HOST_SYS is required by the diskio plugin
        - name: "HOST_SYS"
          value: "/hostfs/sys"
        - name: "HOST_MOUNT_PREFIX"
          value: "/hostfs"
      volumes:
      - name: hostfsro
        hostPath:
          path: /
      - name: config
        configMap:
          name: telegraf-config
      - name: docker-socket
        hostPath:
          path: /var/run/docker.sock
      - name: varlibdockercontainers
        hostPath:
          path: /var/lib/docker/containers
resources/namespace.yaml: Namespaces are used to separate resources in a cluster logically. This file ensures that all the resources for your DaemonSet are deployed in the specified namespace.
apiVersion: v1
kind: Namespace
metadata:
  name: monitoring
resources/role.yaml: Roles are used to grant access to resources within a namespace. This file specifies what actions can be taken on which resources by the service account used by your DaemonSet.
kind: ClusterRole
apiVersion: rbac.authorization.k8s.io/v1
metadata:
  name: telegraf-cluster-role
rules:
  - apiGroups: ["metrics.k8s.io"]
    resources: ["pods"]
    verbs: ["get", "list", "watch"]
  - apiGroups: [""]
    resources: ["nodes", "nodes/proxy", "nodes/stats", "persistentvolumes"]
    verbs: ["get", "list", "watch"]
resources/role-binding.yaml: This file binds a Role to a user, group, or service account. It allows you to specify who can perform actions on the resources defined in the Role within the specified namespace.
apiVersion: rbac.authorization.k8s.io/v1
kind: ClusterRoleBinding
metadata:
  name: telegraf-sa-binding
subjects:
  - kind: ServiceAccount
    name: telegraf-sa
roleRef:
  apiGroup: rbac.authorization.k8s.io
  kind: ClusterRole
  name: telegraf-cluster-role
resources/service_account.yaml: Service accounts provide an identity for processes that run in a Pod. They are used to authenticate with the Kubernetes API server and are associated with Pods that must interact with the cluster's resources.
apiVersion: v1
kind: ServiceAccount
metadata:
  name: telegraf-sa
Deploying the Telegraf Daemonset
At this point in your project directory, you should have the kustomization.yaml file and the resources directory (containing the other 6 yaml files).
Since you should already be using the correct cluster context, you can test (dry run) and then deploy the kustomization.yaml file from within your root project directory:
- kubectl apply -k . --dry-run=client
- kubectl apply -k .
Expected output:
namespace/monitoring created
serviceaccount/telegraf-sa created
clusterrole.rbac.authorization.k8s.io/telegraf-cluster-role created
clusterrolebinding.rbac.authorization.k8s.io/telegraf-sa-binding created
configmap/telegraf-config created
daemonset.apps/telegraf created
You can now get a list of running daemonsets in your cluster and see one with the Name telegraf and a Namespace of monitoring:
- kubectl get daemonsets --all-namespaces
Telegraf will now collect and forward node and pod container/volume/network metrics to your Hosted Graphite trial account. These metrics will be in the Graphite format and can be used in HG to create custom dashboards and alerts. See the official GitHub repository for additional details and configuration options for the inputs. kubernetes plugin.
Locate and Visualize Your Metrics
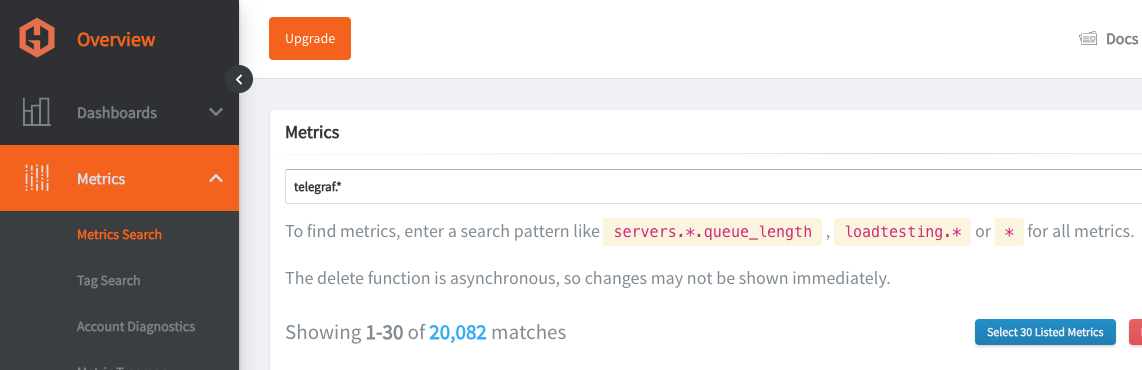
Navigate to your Hosted Graphite trial account => Metrics Search. Your metrics will be prefixed with Telegraf so you can use that as a search parameter and print a full list of your Graphite metrics:
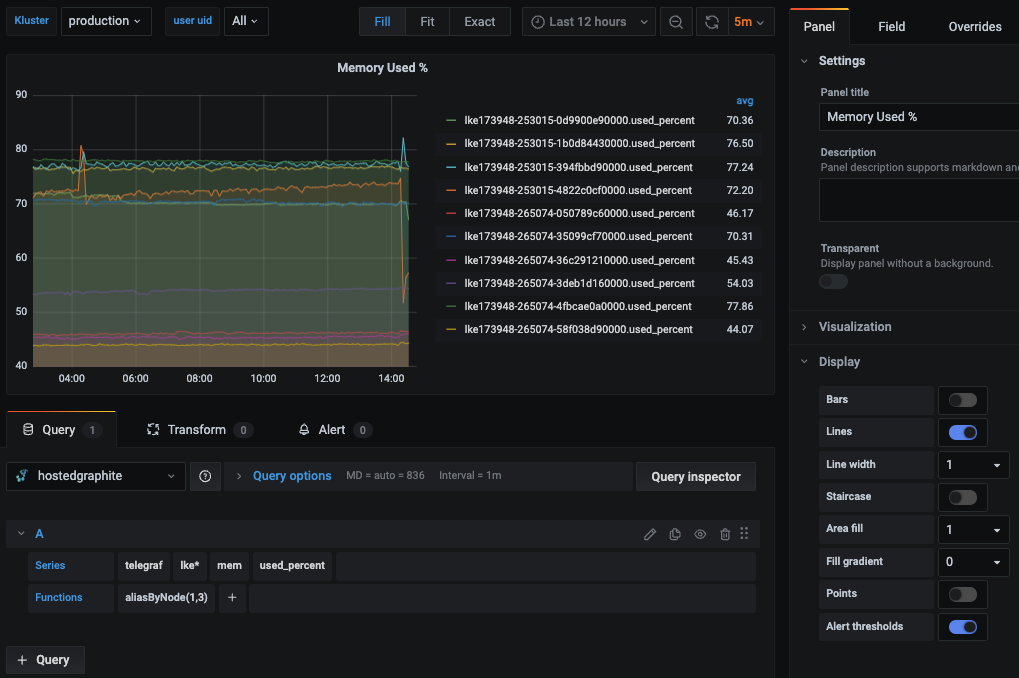
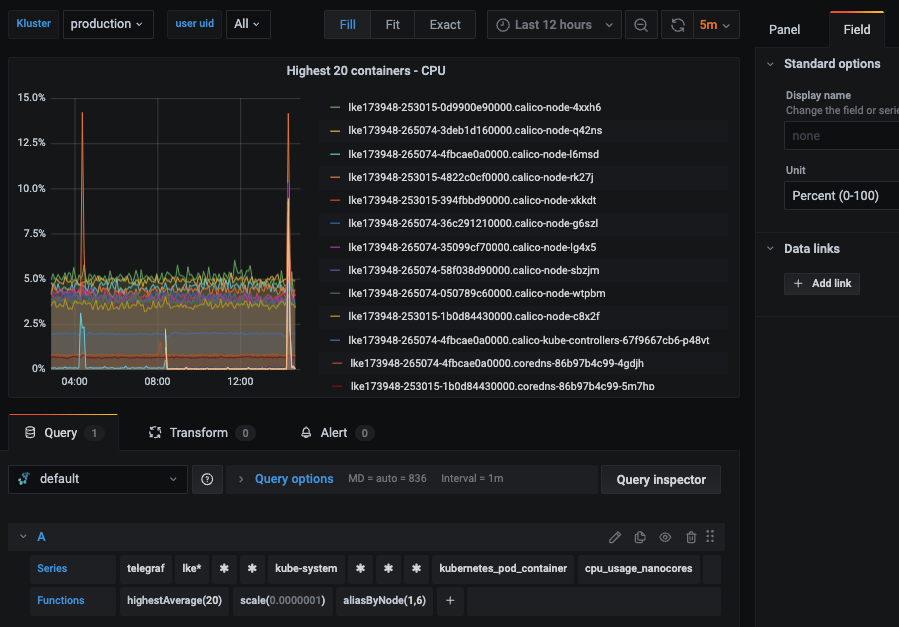
Then you can navigate to Dashboards => Primary Dashboards, select the + button to create a new panel and use the query UI in Edit mode to select a graphite metric path (in HG, the default data source will be the Hosted Graphite backend). See the HG dashboard docs for more details on creating dashboards and using more advanced features like variables, annotations, and Graphite functions:
You can also navigate to the Hosted Graphite Dashboard Library, and generate a pre-made Kubernetes Overview dashboard that will be compatible with you telegraf-k8 metrics.
Configure Graphite Alerts
In the Hosted Graphite UI, navigate to Alerts => Graphite Alerts to create a new alert. Name the alert, add a query to the alerting metric field, and add a description of what this alert is:
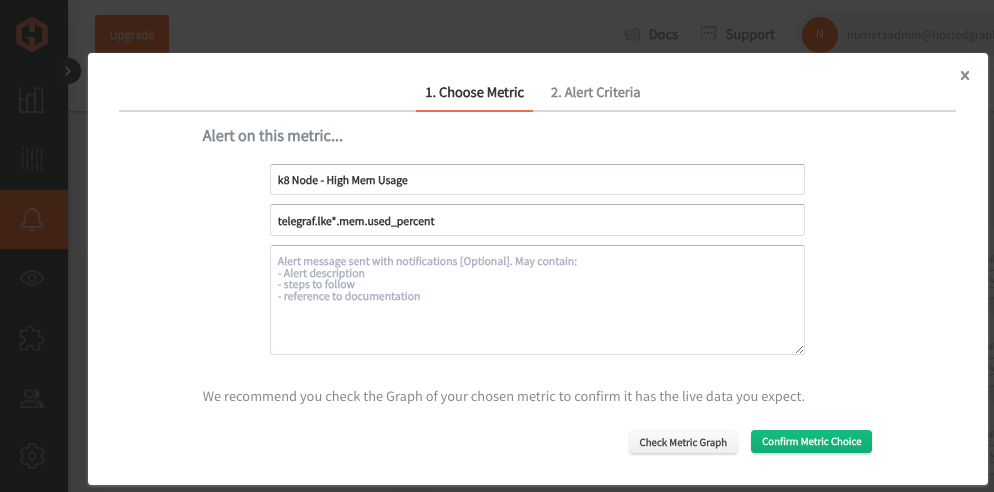
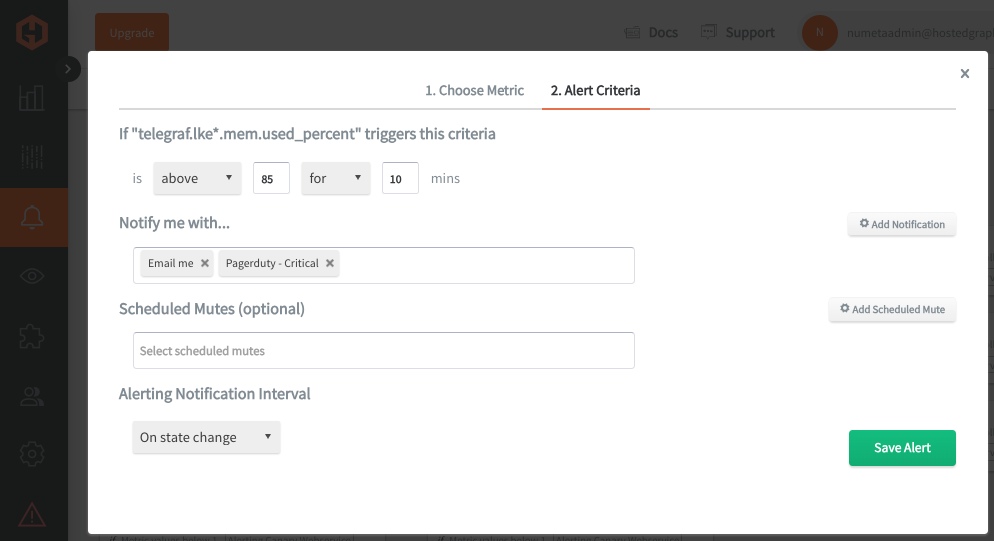
Then, select the Alert Criteria tab to define the threshold and notification channel(s). The default notification channel will be the email you used to sign up for the Hosted Graphite account. You can easily configure additional channels for Slack, PagerDuty, Microsoft Teams, OpsGenie, custom webhooks and more. See the Hosted Graphite docs for more details on notification channels:
Conclusion
Visibility into your Kubernetes infrastructure is crucial for ensuring optimal performance, security, and efficient resource management. It allows you to detect anomalies, diagnose issues, and make informed scaling and resource allocation decisions. Using a Telegraf DaemonSet to collect Graphite data is convenient because it automatically deploys Telegraf on each node, ensuring comprehensive data collection without manual intervention. This approach leverages Telegraf's wide range of input plugins to capture diverse metrics, providing a centralized and consistent monitoring solution across the entire cluster.
Tools like dashboards and alerts will complement your data by providing real-time visualization, proactive identification of issues, historical trend analysis, and facilitating informed decision-making, all essential for maintaining a robust and efficient infrastructure.
Sign up here for a free trial of our Hosted Graphite and Grafana services. If you have any questions about our products or about how MetricFire can help your company, book a demo and talk to us directly.