Table of Contents
Great systems are not just built. They are monitored.
MetricFire is the fully managed Graphite and Grafana platform for small teams that don’t want to self-host their monitoring stack. Pre-built dashboards, alerts, and native add-ons for Heroku, AWS, Azure, and GCP. All with dedicated support and no infrastructure to maintain.
Introduction
Nagios is an open-source monitoring system used to track the performance and health of IT infrastructure, including servers, network devices, applications, and services. It is widely used because of its ability to provide real-time alerts, identify issues before they become critical, and ensure uptime by detecting and addressing system failures promptly. Monitoring Nagios plugins on a more robust platform allows for better scalability, deeper analytics, and long-term storage of performance data. This approach enhances visibility into system health, enables real-time alerting, and provides more detailed insights into trends and anomalies beyond Nagios' native capabilities.
In this article, we'll detail how to use the Telegraf agent to collect Nagios plugin performance statistics, and forward them to a data source.
Getting Started with the Telegraf Agent
Telegraf is a plugin-driven server agent built on InfluxDB that collects and sends metrics/events from databases, systems, processes, devices, and applications. It is written in Go, compiles into a single binary with no external dependencies, and requires a minimal memory footprint. Telegraf is compatible with many operating systems and has many helpful output plugins and input plugins for collecting and forwarding a wide variety of system performance metrics.
Install Telegraf (Linux/Redhat)
/etc/telegraf/sudo wget https://dl.influxdata.com/telegraf/releases/telegraf_1.30.0-1_amd64.deb
sudo dpkg -i telegraf_1.30.0-1_amd64.deb
RedHat/CentOS
sudo wget https://dl.influxdata.com/telegraf/releases/telegraf-1.30.0-1.x86_64.rpm
sudo yum localinstall telegraf-1.30.0-1.x86_64.rpm
Configure an Output
You can configure Telegraf to output to various sources, such as Kafka, Graphite, InfluxDB, Prometheus, SQL, NoSQL, and more.
In this example, we will configure telegraf with a Graphite output. If you're not currently hosting your data source, start a 14-day free trial with Hosted Graphite by MetricFire to follow these next steps.
A Hosted Graphite account will provide the data source, offer an alerting feature, and include Hosted Grafana as a visualization tool.
To configure the Graphite output, locate the downloaded telegraf configuration file at /etc/telegraf/telegraf.conf and open it in your preferred text editor. Then, you will need to make the following changes to the file:
First, uncomment the line:
[[outputs.graphite]]
Next, uncomment and edit the server line to:
servers = ["carbon.hostedgraphite.com:2003"]
Finally, uncomment and edit the prefix line to:
prefix = "<YOUR_API_KEY>.telegraf"
Configure Your Nagios Plugins
This article assumes that you're already using Nagios plugins as part of your monitoring infrastructure, but here's a quick install guide (ubuntu) if you want to configure this for testing purposes:
- Install Nagios plugins (Linux-ubuntu):
- sudo apt install nagios-plugins
- sudo apt install nagios-plugins-contrib
- Some of the additional (contrib) plugins require perl dependencies:
- sudo apt-get install libmonitoring-plugin-perl
- sudo apt-get install libmonitoring-plugin-perl
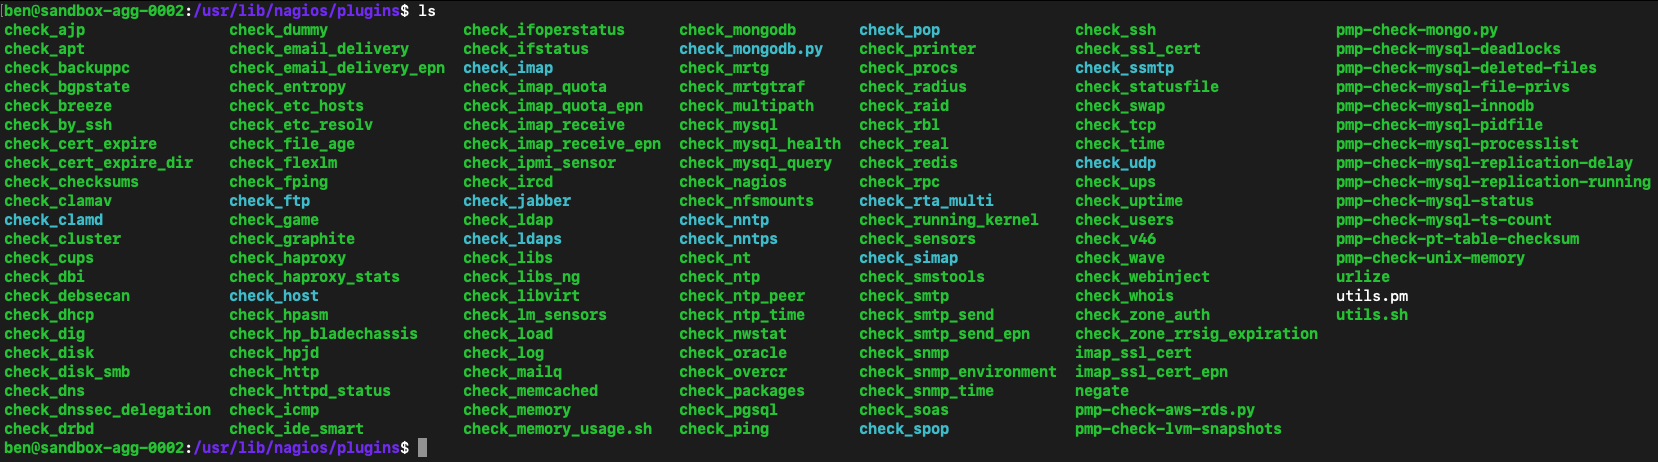
- Now you can see a full list of installed plugins at: /usr/lib/nagios/plugins
- Test the load plugin: /usr/lib/nagios/plugins/check_load -w 10,20,30 -c 15,25,35
- Expected output: OK - load average: 3.10, 2.59, 2.25|load1=3.100;10.000;15.000;0; load5=2.590;20.000;25.000;0; load15=2.250;30.000;35.000;0;
- Create a simple bash script at /usr/local/bin/collect_nagios_metrics.sh to collect nagios stats:
-
#!/bin/bash

# Check system load
/usr/lib/nagios/plugins/check_load -w 10,20,30 -c 15,25,35

# Check disk space on root partition
/usr/lib/nagios/plugins/check_disk -w 20% -c 10% -p /

# Check memory
/usr/lib/nagios/plugins/check_memory -w 80 -c 90


# Commented out below to reduce metric overhead
# Check swap usage
# /usr/lib/nagios/plugins/check_swap -w 20% -c 10%

# Check PING on an IP
# /usr/lib/nagios/plugins/check_ping -H <hostname-IP> -w 100,20% -c 200,40%

# Check SNMP OS/version
# /usr/lib/nagios/plugins/check_snmp -H 127.0.0.1 -C public -o 1.3.6.1.2.1.1.1.0

# Check for patterns in the syslog
# sudo /usr/lib/nagios/plugins/check_log -F /var/log/syslog -O /tmp/nagios_log_check_syslog.state -q "error"
# sudo /usr/lib/nagios/plugins/check_log -F /var/log/syslog -O /tmp/nagios_log_check_syslog.state -q "warning"

# Check time to resolve DNS on a URL
# /usr/lib/nagios/plugins/check_dns -H <your-url.com>

# Check MySQL queries
# /usr/lib/nagios/plugins/check_mysql_query -H localhost -u nagios -p nagios_password -q "SELECT COUNT(*) FROM information_schema.processlist WHERE command='Query';"
# /usr/lib/nagios/plugins/check_mysql_query -H localhost -u nagios -p nagios_password -q "SELECT 1;"

# Check for APT critical package updates and available upgrades
# /usr/lib/nagios/plugins/check_apt

# Check number of users logged in
# /usr/lib/nagios/plugins/check_users -w 5 -c 10

# Check time synchronization
# /usr/lib/nagios/plugins/check_ntp -H <hostname>

# Check RAID
# /usr/lib/nagios/plugins/check_raid

# Check hardware sensors
# /usr/lib/nagios/plugins/check_sensors

# Check system uptime
# /usr/lib/nagios/plugins/check_uptime

# Check SSH
# /usr/lib/nagios/plugins/check_ssh -H <hostname>
-
- Make the script executable: sudo chmod +x /usr/local/bin/collect_nagios_metrics.sh
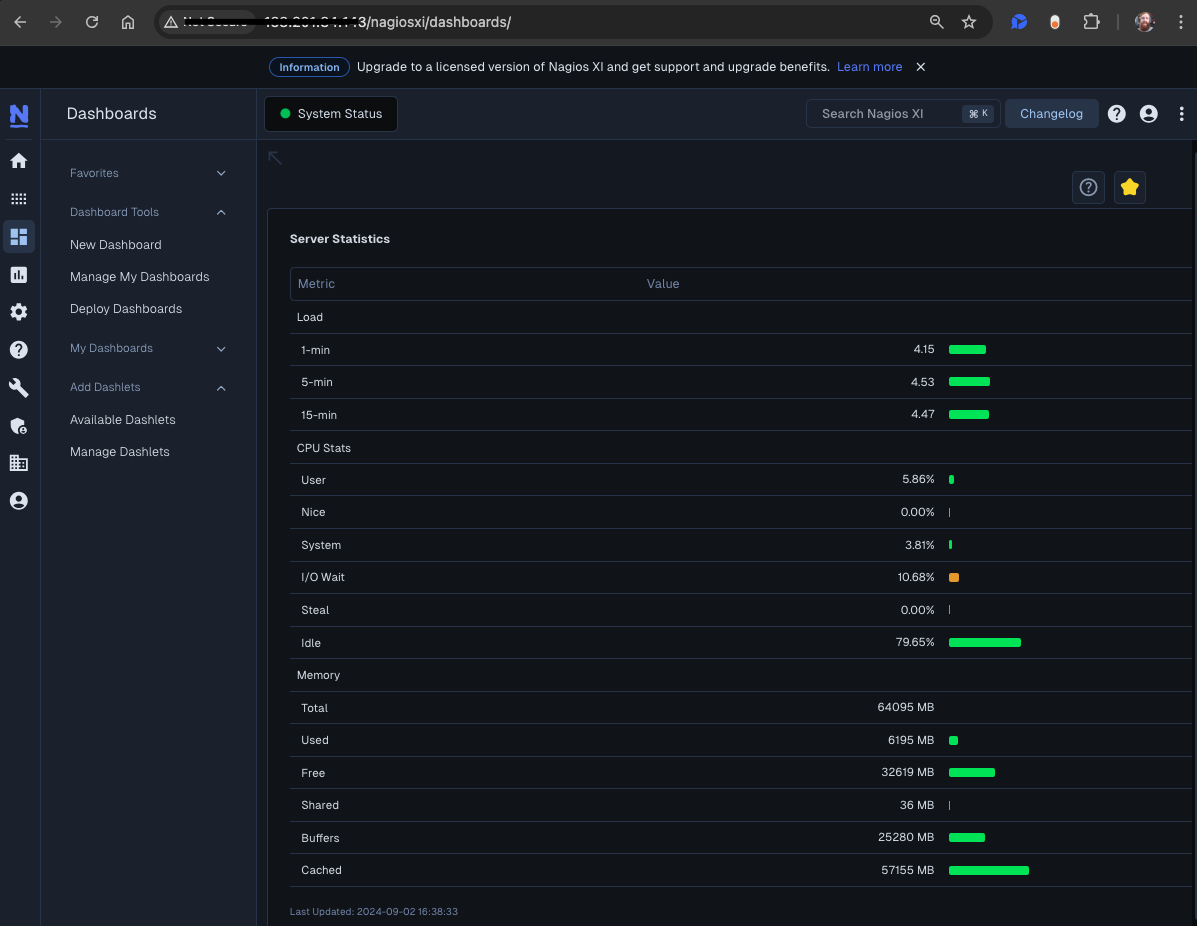
- NOTE: Similar configurations are possible for other versions of Nagios, like Nagios Core and Nagios XI. These versions can be useful if you want to interact with their browser interface, but in this example we are just demonstrating how to send data from their basic nagios-plugins package.
Configure Telegraf to Read Your Script
Telegraf has many input plugins that can collect a wide range of data from many popular technologies and 3rd party sources. In this example, we'll demonstrate how to collect and forward metrics from your local collect_nagios_metrics.sh script.
First, you will need to search for the inputs.exec section in your telegraf.conf file, and uncomment the [[inputs.exec]] line:
[[inputs.exec]]
Then just uncomment and modify the 'commands' and 'data_format' lines:
  commands = ["/usr/local/bin/collect_nagios_metrics.sh"]
  data_format = "nagios"
Finally, you can save your changes and run the telegraf daemon using the following command. This will help you see if there are any configuration errors in the output:
telegraf --config telegraf.conf
NOTE: certain Nagios checks can produce a large number of unique metrics, if this is the case you might consider using another Telegraf input plugin for your system performance monitoring.
See the official GitHub repository for additional details and configuration options for the exec plugin (using the nagios data format).
Use Hosted Graphite by MetricFire to Create Custom Dashboards and Alerts
MetricFire is a monitoring platform that enables you to gather, visualize and analyze metrics and data from servers, databases, networks, processes, devices, and applications. Using MetricFire, you can effortlessly identify problems and optimize resources within your infrastructure. Hosted Graphite by MetricFire removes the burden of self-hosting your monitoring solution, allowing you more time and freedom to work on your most important tasks.
Once you have signed up for a Hosted Graphite account and used the above steps to configure your server(s) with the Telegraf Agent, metrics will be forwarded, timestamped, and aggregated into the Hosted Graphite backend.
-
Metrics will be sent and stored in the Graphite format of: metric.name.path <numeric-value> <unix-timestamp>
-
The dot notation format provides a tree-like data structure, making it efficient to query
-
Metrics are stored in your Hosted Graphite account for two years, and you can use them to create custom Alerts and Grafana dashboards.
Build Dashboards in Hosted Graphite's Hosted Grafana
In the Hosted Graphite UI, navigate to Dashboards and select + New Dashboard to create a new visualization.
Then go into Edit mode and use the Query UI to select a graphite metric path (the default data source will be the HostedGraphite backend if you are accessing Grafana via your HG account).
The HG datasource also supports wildcard (*) searching to grab all metrics that match a specified path.
Now you can apply Graphite functions to these metrics like groupByNode() to combine the value of multiple metrics into a single (AVG) value:
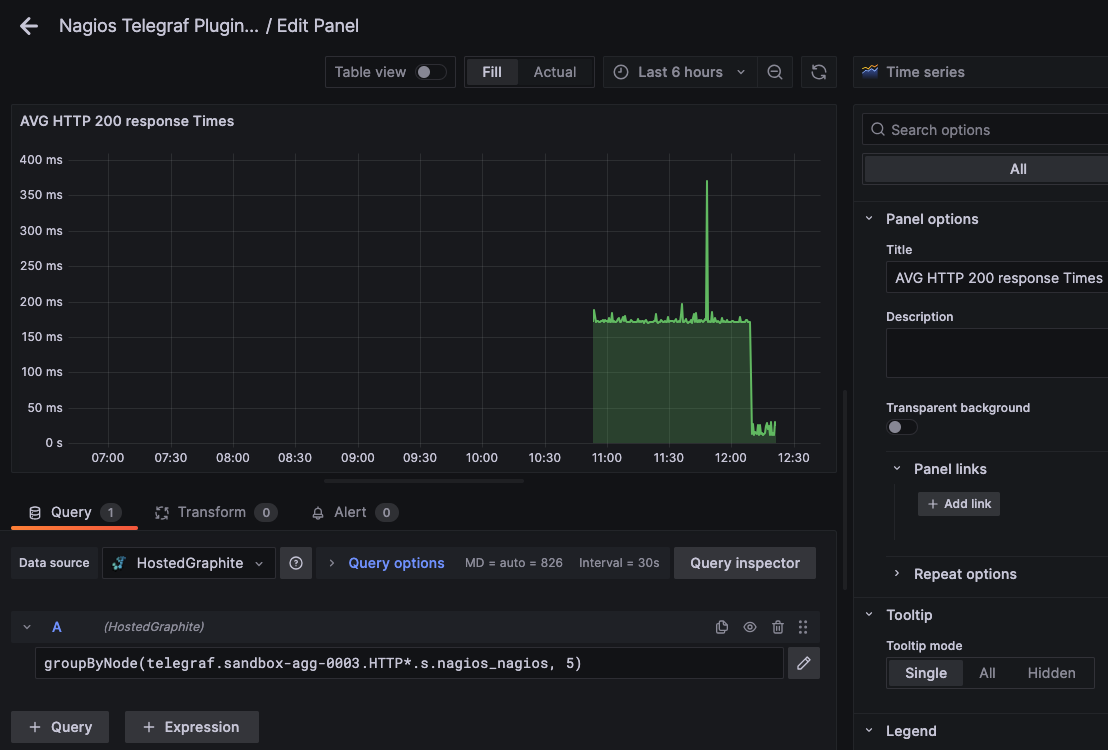
Grafana has many additional options to apply different visualizations, modify the display, set units of measurement, and some more advanced features like configuring dashboard variables and event annotations.
The above example has a dashboard variable configured for 'instance' at index 4 of the metric series. See the Hosted Graphite dashboard docs for more details.
Creating Graphite Alerts
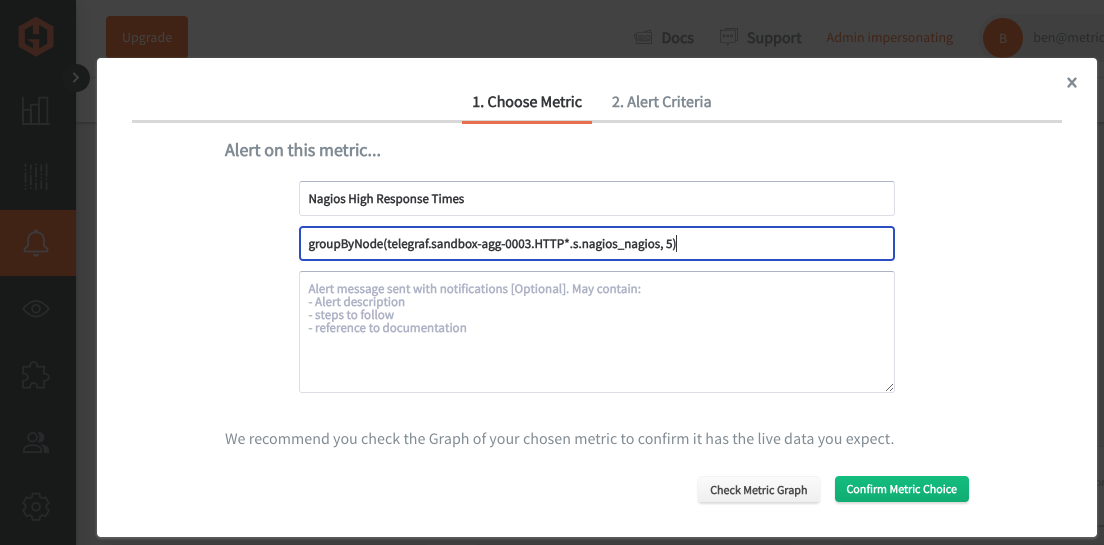
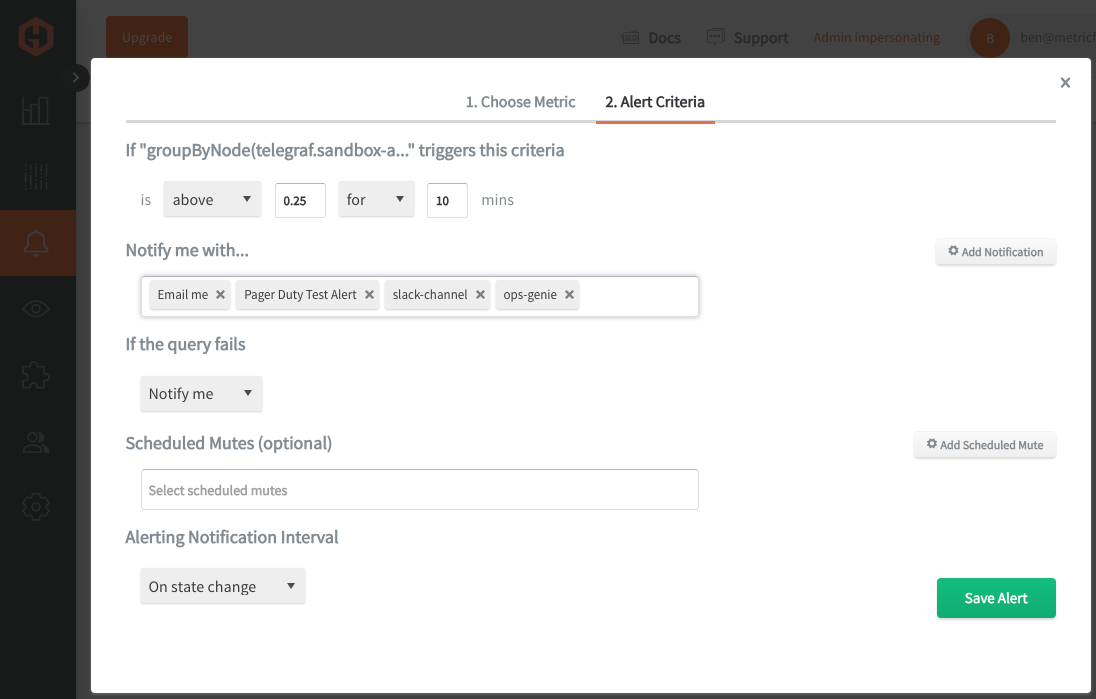
In the Hosted Graphite UI, navigate to Alerts => Graphite Alerts to create a new alert. Name the alert, add a query to the alerting metric field, and add a description of what this alert is:
Then, select the Alert Criteria tab to set a threshold and select a notification channel. The default notification channel will be the email you used to sign up for the Hosted Graphite account. Still, you can easily configure channels for Slack, PagerDuty, Microsoft Teams, OpsGenie, custom webhooks and more. See the Hosted Graphite docs for more details on notification channels:
Conclusion
Monitoring the performance of your systems is crucial to ensure the availability, reliability, and optimal functioning of critical infrastructure components. By proactively identifying issues like resource bottlenecks, failures, or abnormal usage patterns, businesses can prevent downtime and minimize the impact of outages. Nagios provides real-time insights by continuously monitoring servers, applications, and services, allowing administrators to detect problems early and take corrective action before they escalate into larger issues.
Tools like dashboards and alerts will complement your data by providing real-time visualization, proactive identification of issues, historical trend analysis, and facilitating informed decision-making, all essential for maintaining a robust and efficient infrastructure.
Sign up for the free trial and begin monitoring your infrastructure today. You can also book a demo and talk to the MetricFire team directly about your monitoring needs.