Table of Contents
Great systems are not just built. They are monitored.
MetricFire runs Graphite and Grafana as a fully managed service for growing engineering teams, taking care of storage, scaling, and version updates so your team doesn't have to. Plans start at $19/month, billed per metric namespace rather than per host, and include engineer-staffed support. Integrations work natively with Heroku, AWS, Azure, and GCP, and data is stored with 3× redundancy in SOC2- and ISO:27001-certified data centres.
Introduction
If you're already using OpenTelemetry for tracing and logs, adding otelcol-contrib as an agent for system metrics just makes sense. It keeps everything in the same pipeline, so you’re not juggling multiple monitoring tools or dealing with inconsistent data formats. Plus, with built-in support for host metrics, custom processing, and direct exports to Graphite, it’s a solid way to ship performance data without extra overhead.
In this article, we'll detail how to install the OpenTelemetry Collector Contrib distribution, and configure it to export system performance metrics to a Graphite datasource.
Install and Configure OpenTelemetry
OpenTelemetry as an agent collects, processes, and exports system metrics, making it easy to track the performance across your infrastructure without extra dependencies. It pulls data using built-in scrapers, can apply transformations, and ships it straight to your preferred backend—no manual parsing or custom scripts needed. This article assumes that you are already using OpenTelemetry, but below are examples on how to install/configure otelcol-contrib so you can quickly and easily get system metrics to a carbon endpoint.
Install OpenTelemetry Contrib (Linux)
/etc/otelcol-contrib/Ubuntu/Debian (AMD)
wget https://github.com/open-telemetry/opentelemetry-collector-releases/releases/download/v0.118.0/otelcol-contrib_0.118.0_linux_amd64.deb

sudo dpkg -i otelcol-contrib_0.118.0_linux_amd64.deb
RedHat/CentOS (AMD)
wget https://github.com/open-telemetry/opentelemetry-collector-releases/releases/download/v0.119.0/otelcol-contrib_0.119.0_linux_amd64.rpm

sudo rpm -ivh otelcol-contrib_0.119.0_linux_amd64.rpm
Confirm Installation
otelcol-contrib --version
Configure the Hostmetrics Receiver and Carbon Exporter
The hostmetrics receiver in OpenTelemetry pulls system-level metrics like CPU, memory, disk, and network usage, giving you real-time visibility into infrastructure performance without extra agents.
The carbon exporter takes those metrics and ships them straight to Graphite-compatible backends, making it easy to integrate OpenTelemetry into existing monitoring stacks with minimal setup.
If you're not currently hosting your own Graphite data source, start a 14-day free trial with Hosted Graphite by MetricFire to follow along.
A MetricFire account will provide the Graphite data source, offer alerting features, and include Hosted Grafana as a visualization tool - along with Integrations and Team features.
- First, find the configuration file generally located at: /etc/otelcol-contrib/config.yaml and open it in your preferred text editor.
- Then you can either replace the file, or add the following sections to your current config (NOTE: be sure to include your HG-API-KEY and HOSTNAME):
receivers:
  hostmetrics:
    collection_interval: 30s
    scrapers:
      cpu: {}
      memory: {}
      load: {}
      filesystem: {}
      disk: {}
      paging: {}
      network: {}
      processes: {}
      process: {}
      system: {}

processors:
  batch: {}
  metricstransform:
    transforms:
      - include: ".*"
        match_type: regexp
        action: update
        new_name: "<HG-API-KEY>.opentel.$$0"
        operations:
          - action: add_label
            new_label: host
            new_value: <HOSTNAME>

exporters:
  carbon:
    endpoint: "carbon.hostedgraphite.com:2003"
    timeout: 10s

service:
  pipelines:
    metrics:
      receivers:
        - hostmetrics
      processors:
        - batch
        - metricstransform
      exporters:
        - carbon
Now, just save the file and restart the otelcol-contrib service:
sudo systemctl restart otelcol-contrib
sudo systemctl status otelcol-contrib
Or you can server the file manually - to troubleshoot potential configuration errors:
otelcol-contrib --config /etc/otelcol-contrib/config.yaml
Ship Tagged Graphite Metrics
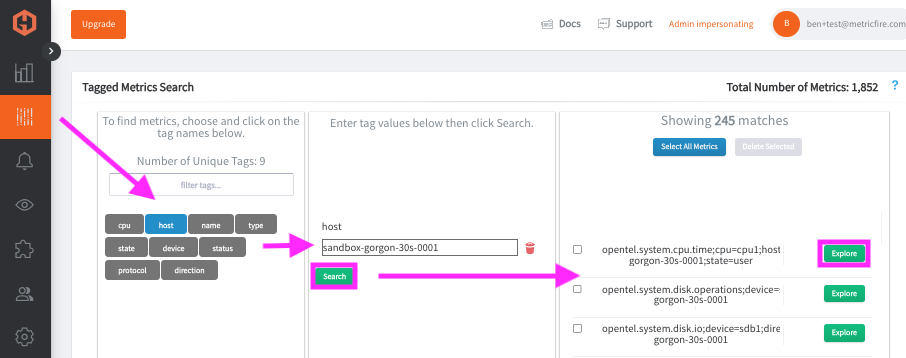
Within two minutes of restarting the otelcol-contrib service, about 200-250 Tagged Graphite metrics will be forwarded to your Hosted Graphite account (with the opentel prefix).
Why does OpenTelemetry forward Tagged metrics?
- Because it's core model aligns more with Prometheus-style 'labels' than Graphite's 'dot notation' formatting. Instead of flattening data into long metric names, it preserves the labels by using Graphite tags, which enables richer filtering in your Graphite backend.
Now you can locate these Tagged Metrics in the Hosted Graphite Tag Search UI:
Otherwise, you can configure a different exporter to forward metrics to another data source.
Use Hosted Graphite by MetricFire to Create Custom Dashboards and Alerts
MetricFire is a monitoring platform that enables you to gather, visualize and analyze metrics and data from servers, databases, networks, processes, devices, and applications. Using MetricFire, you can effortlessly identify problems and optimize resources within your infrastructure. Hosted Graphite by MetricFire removes the burden of self-hosting your monitoring solution, allowing you more time and freedom to work on your most important tasks.
Metrics sent to the public carbon endpoint will be timestamped, and aggregated into the Hosted Graphite backend.
-
Metrics will be sent and stored in the Graphite Tag format of: my.series;tag1=value1;tag2=value2 metric_value (timestamp)
-
The tags provide a filtering option, making the metrics efficient to query
-
Metrics are stored in your Hosted Graphite account for two years, and you can use them to create custom Alerts and Grafana dashboards.
Build Custom Dashboards in MetricFire's Hosted Grafana
In the Hosted Graphite UI, navigate to Dashboards and select + New Dashboard to create a new visualization.
Then go into Edit mode and use the Query UI to select a graphite metric path (the default data source will be HostedGraphite if you are accessing Grafana via your HG account).
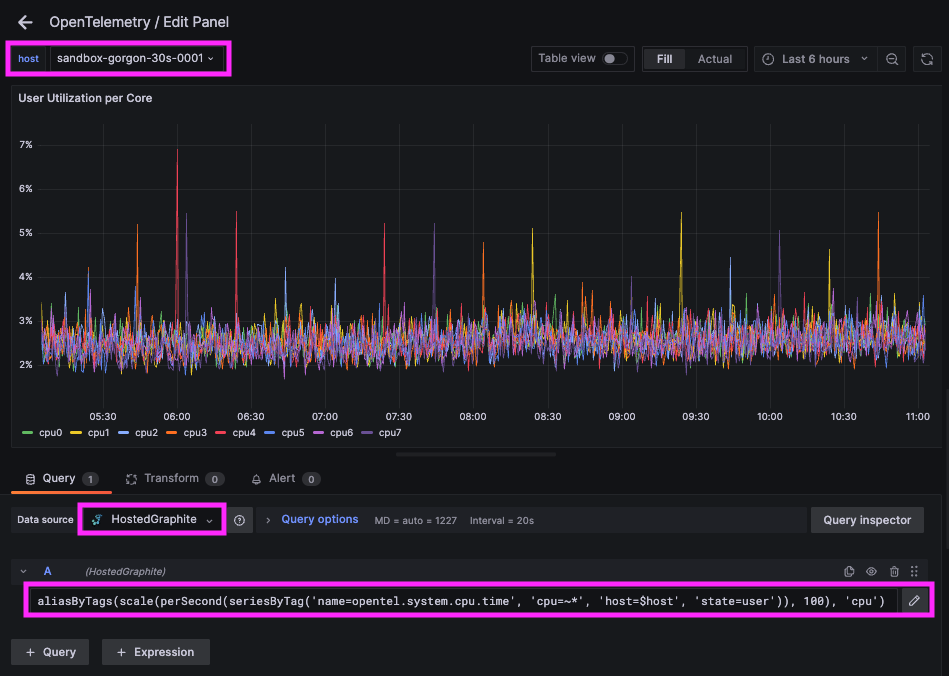
The below visualization example includes several key points to be aware of:
- To query Tagged metrics, you must apply the aliasByTags() Graphite function. There are also other functions that can transform your data in useful ways, such as scale() and perSecond()
- This example is configured with a Variable (defined in Dashboard Settings => Variables) to target the host tag, e.g: host=$host
- To use wildcards with tags, you must format your tag query with tilde and asterisk characters, e.g: tag=~* or cpu=~*
Grafana has many additional options to apply different visualizations, modify the display, set units of measurement, and some more advanced features like configuring event annotations.
We also have a pre-made OpenTelemetry dashboard that you can generate from within our Dashboard Library. This dashboard can be further customized and offers a great starting point for your host monitoring:

Creating Graphite Alerts
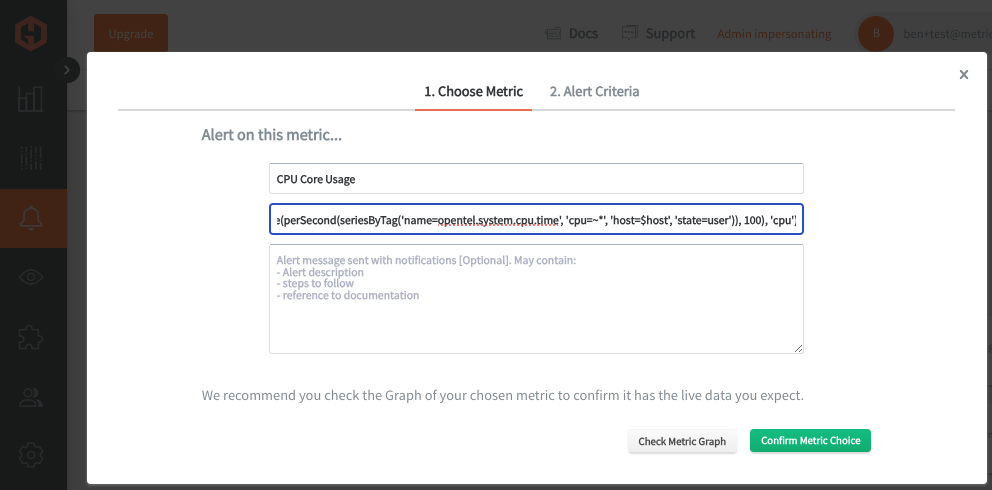
In the Hosted Graphite UI, navigate to Alerts => Graphite Alerts to create a new alert. Name the alert, add a metric query to the alerting metric field, and add a description of what this alert is:
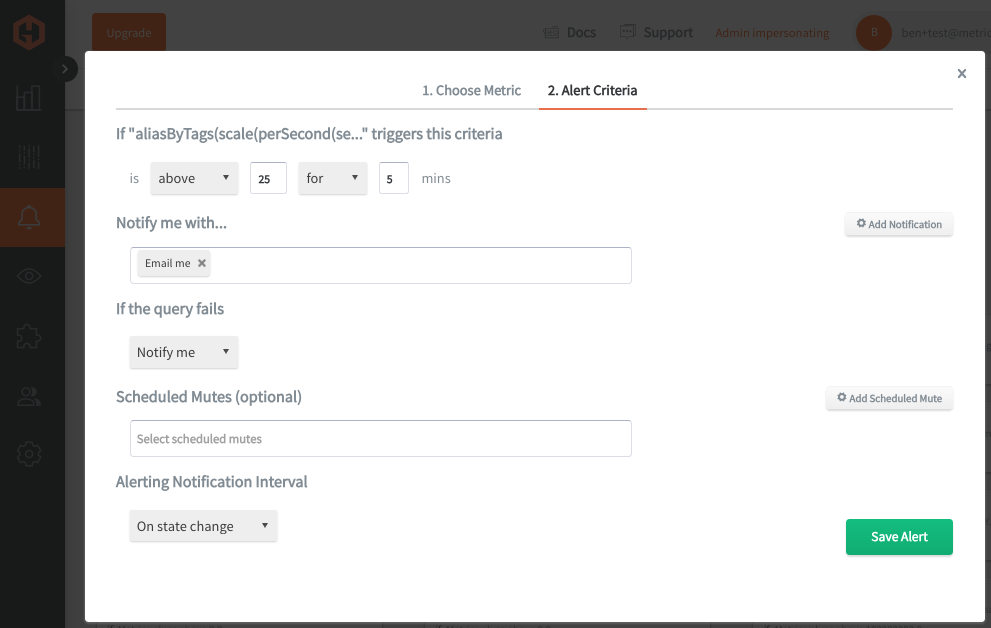
Then, select the Alert Criteria tab to set a threshold and select a notification channel. The default notification channel will be the email you used to sign up for the Hosted Graphite account. Still, you can easily configure channels for Slack, PagerDuty, Microsoft Teams, OpsGenie, custom webhooks and more. See the Hosted Graphite docs for more details on notification channels:
Conclusion
Using OpenTelemetry Contrib as an agent makes it easy to collect and forward system performance metrics without needing multiple monitoring tools. By configuring the hostmetrics receiver and carbon exporter, you can send rich, tagged metrics directly to Hosted Graphite, keeping your observability pipeline clean and flexible. Agent-based monitoring is a no-brainer—it runs lightweight in the background, scales effortlessly, and gives you real-time insights into system health without extra manual work.
Sign up for the free trial and begin monitoring your infrastructure today. You can also book a demo and talk to the MetricFire team directly about your monitoring needs.