Table of Contents
Great systems are not just built. They are monitored.
MetricFire runs Graphite and Grafana as a fully managed service for small engineering teams, taking care of storage, scaling, and version updates so your team doesn't have to. Plans start at $19/month, billed per metric namespace rather than per host, and include engineer-staffed support. Integrations work natively with Heroku, AWS, Azure, and GCP, and data is stored with 3× redundancy in SOC2- and ISO:27001-certified data centres.
Introduction
Aerospike is a high-performance, real-time NoSQL database built for speed, scale, and low-latency transactions—think millions of reads/writes per second without breaking a sweat. When you're dealing with high-throughput applications, keeping an eye on Aerospike’s performance isn't just a good idea—it's mission-critical to avoid bottlenecks, connection issues, or unexpected slowdowns. By integrating it with OpenTelemetry, you can track key metrics, detect anomalies, and keep your database humming smoothly.
In this article, we'll explain how to configure the OpenTelemetry Collector to scrape and export Aerospike metrics to a Hosted Carbon endpoint.
Getting Started With Aerospike
This guide uses the Enterprise Edition of Aerospike, as it doesn't require manual downloads. However, Aerospike Enterprise requires a license for long-term use. If you prefer a free, license-free option, you can download the Community Edition. This article assumes that you're already running an instance of Aerospike on your server but if you want to follow along for testing purposes, here's how to get up and running in a Linux environment.
Install & Unpack Aerospike (ubuntu)
Aerospike provides different .tgz files for each Ubuntu version so Instead of manually selecting a version, just use lsb_release -rs to fetch it dynamically:
OS_VERSION=$(lsb_release -rs)

wget -O aerospike.tgz "https://download.aerospike.com/artifacts/aerospike-server-enterprise/6.2.0.0/aerospike-server-enterprise_6.2.0.0_tools-8.0.2_ubuntu${OS_VERSION}_x86_64.tgz"
Extract the Package
tar -xvzf aerospike.tgz
cd aerospike-server-enterprise_*
Install the Aerospike Server, Tools, and Command Line Utility
sudo dpkg -i aerospike-server-enterprise_*.deb
sudo dpkg -i aerospike-tools_*.deb
Start Service, Enable on Boot, and Verify the Installation
sudo systemctl start aerospike
sudo systemctl enable aerospike
sudo systemctl status aerospike

asadm --version
asadm -e "show statistics"
Configure an Aerospike Namespace (optional)
Aerospike uses namespaces instead of traditional databases. By default, it includes test and bar.
You can locate these default namespaces at /etc/aerospike/aerospike.conf to remove them and define your own:
namespace mynamespace {
    replication-factor 1
    memory-size 2G
    storage-engine memory
}
Then just restart the service to apply the changes:
sudo systemctl restart aerospike
sudo systemctl status aerospike
Insert Sample Data
Enter the Aerospike command line with: aql
Create a Set (Table Equivalent):
INSERT INTO mynamespace.employees (PK, name, age, email) VALUES ('user1', 'Ben', 40, 'ben@metricfire.com');

INSERT INTO mynamespace.employees (PK, name, age, email) VALUES ('user2', 'Elliot', 34, 'elliot@metricfire.com');
Check inserted records:
SELECT * FROM mynamespace.employees;
Update a record (with aql, you re-insert instead of an explicit UPDATE command):
INSERT INTO mynamespace.employees (PK, name, age, email) VALUES ('user1', 'Benjamin-Pitts', 40, 'ben@metricfire.com');
Delete a record:
DELETE FROM mynamespace.employees WHERE PK = 'user1';
Install and Configure OpenTelemetry
OpenTelemetry as a Collector has built-in support for NGINX, PostgreSQL, Redis, RabbitMQ, Kubernetes, Elasticsearch, and many more! These Receivers pull key performance metrics directly from your services—no manual parsing or custom scripts needed. This article assumes you already use OpenTelemetry, but below are examples of how to install and configure otelcol-contrib to quickly collect system metrics and export them to a Carbon endpoint.
Install OpenTelemetry Collector Contrib (Linux)
/etc/otelcol-contrib/Ubuntu/Debian (AMD)
wget https://github.com/open-telemetry/opentelemetry-collector-releases/releases/download/v0.119.0/otelcol-contrib_0.119.0_linux_amd64.deb

sudo dpkg -i otelcol-contrib_0.119.0_linux_amd64.deb
RedHat/CentOS (AMD)
wget https://github.com/open-telemetry/opentelemetry-collector-releases/releases/download/v0.119.0/otelcol-contrib_0.119.0_linux_amd64.rpm

sudo rpm -ivh otelcol-contrib_0.119.0_linux_amd64.rpm
Confirm the Installation
otelcol-contrib --version
Configure the Aerospike Receiver and Carbon Exporter
The Aerospike Receiver in OpenTelemetry collects metrics from localhost:3000, processes them, and forwards them to your exporter of choice.
The Carbon Exporter takes those metrics and ships them straight to Graphite-compatible backends, making it easy to integrate OpenTelemetry with minimal setup.
If you're not currently hosting your own Graphite data source, start a 14-day free trial with Hosted Graphite by MetricFire to continue following along with this example. A MetricFire account will provide the Graphite data source and include Hosted Grafana as a visualization tool - along with Alerting, Integrations, and Team features.
- First, find the OTel configuration file generally located at: /etc/otelcol-contrib/config.yaml and open it in your preferred text editor.
- Then you can either replace the file, or add the following sections to your current config.
- Be sure to include your HG-API-KEY and HOSTNAME.
receivers:
  aerospike:
    endpoint: "localhost:3000"
    collect_cluster_metrics: true

processors:
  batch: {}
  metricstransform:
    transforms:
      - include: ".*"
        match_type: regexp
        action: update
        new_name: "<HG-API-KEY>.opentel.$$0"
        operations:
          - action: add_label
            new_label: host
            new_value: <HOSTNAME>

exporters:
  carbon:
    endpoint: "carbon.hostedgraphite.com:2003"
    timeout: 10s

service:
  pipelines:
    metrics:
      receivers:
        - aerospike
      processors:
        - batch
        - metricstransform
      exporters:
        - carbon
Now, just save the file and restart the otelcol-contrib service:
sudo systemctl restart otelcol-contrib
sudo systemctl status otelcol-contrib
Or you can server the file manually - to troubleshoot potential configuration errors:
otelcol-contrib --config /etc/otelcol-contrib/config.yaml
Ship Tagged Graphite Metrics
Within two minutes of restarting the otelcol-contrib service, a set of Tagged Graphite metrics will be forwarded to your Hosted Graphite account (with the opentel.aerospike prefix).
Why does OpenTelemetry export Tagged metrics to Carbon?
- Because it's core model aligns more with Prometheus-style 'labels' than Graphite's 'dot notation' formatting. Instead of flattening data into long metric names, it preserves the labels by using Graphite tags, which enables richer filtering in your Graphite backend.
Now you can locate these Tagged Metrics in the Hosted Graphite Tag Search UI - under the host tag:
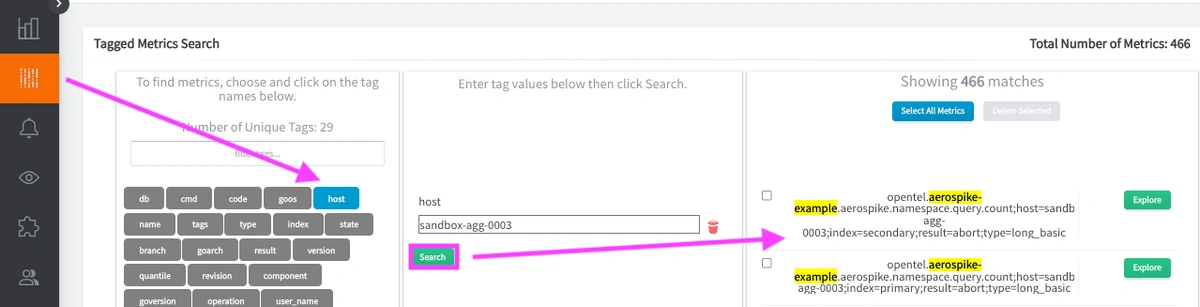
Otherwise, you can configure a different exporter to forward metrics to another data source.
You can also run more aql commands (select/insert/delete) to see how they affect your metric values.
Use Hosted Graphite by MetricFire to Create Custom Dashboards and Alerts
MetricFire is a monitoring platform that enables you to gather, visualize and analyze metrics and data from servers, databases, networks, processes, devices, and applications. Using MetricFire, you can effortlessly identify problems and optimize resources within your infrastructure. Hosted Graphite by MetricFire removes the burden of self-hosting your monitoring solution, allowing you more time and freedom to work on your most important tasks.
Metrics sent to the public carbon endpoint will be timestamped, and aggregated into the Hosted Graphite backend.
-
OpenTelemetry metrics will be sent and stored in the Graphite Tag format of: my.series;tag1=value1;tag2=value2 metric_value (timestamp)
-
The tags provide a filtering option, making the metrics efficient to query
-
Metrics are stored in your Hosted Graphite account for two years, and you can use them to create custom Dashboards and Alerts.
Build Custom Dashboards in MetricFire's Hosted Grafana
In the Hosted Graphite UI, navigate to Dashboards and select + New Dashboard to create a new visualization.
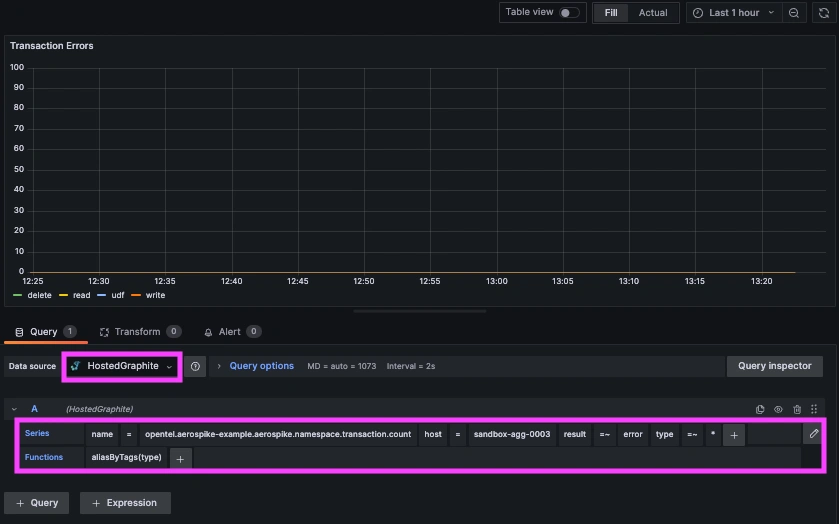
Then go into Edit mode and use the Query UI to select a graphite metric path (the default data source will be HostedGraphite if you are accessing Grafana via your HG account).
NOTE: To query Tagged metrics, you must apply the seriesByTag Graphite function - the aliasByTags function is optional but makes your metric names more readable on the graph.
Grafana has many additional options to apply different visualizations, modify the display, set units of measurement, and some more advanced features like configuring dashboard variables and event annotations.
Here's an example of a dashboard that was built using the Aerospike => OTel => Graphite metrics:
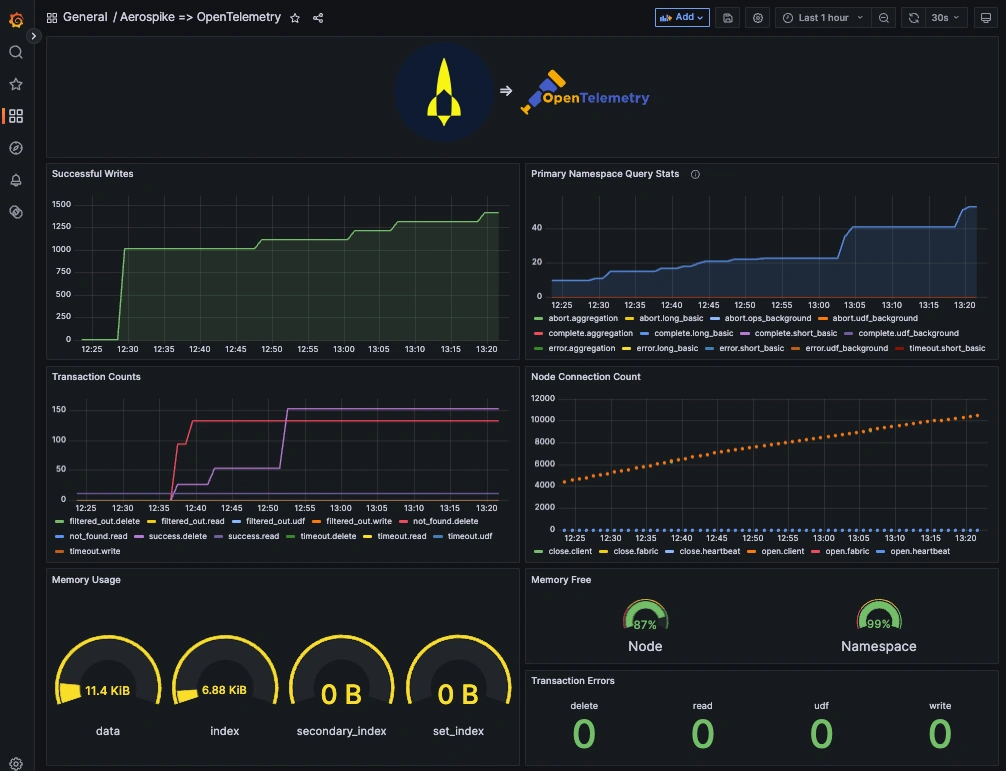
See the Hosted Graphite Dashboard docs for more details around building custom Grafana visualizations.
Creating Graphite Alerts
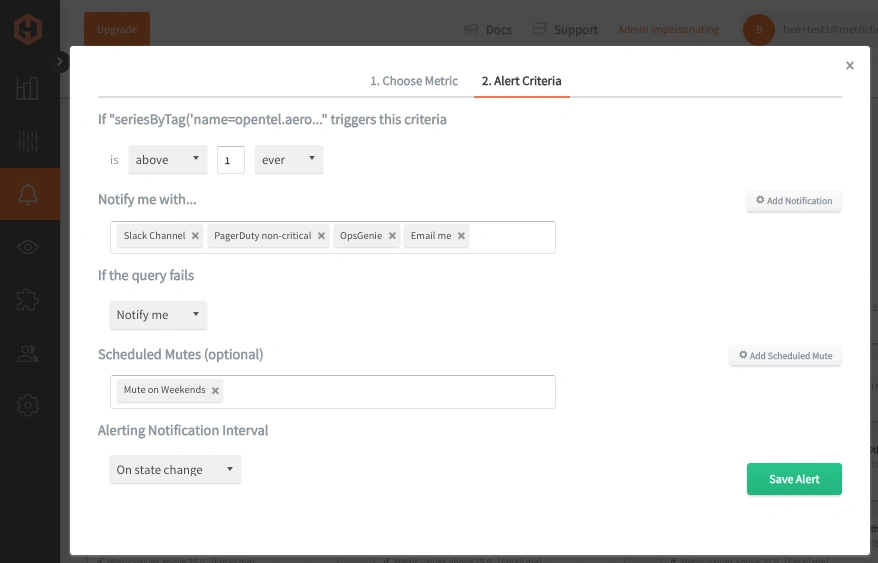
In the Hosted Graphite UI, navigate to Alerts => Graphite Alerts to create a new alert. Name the alert, add your Tagged Aerospike Metric to the alerting metric field, and add a description of what this alert is:
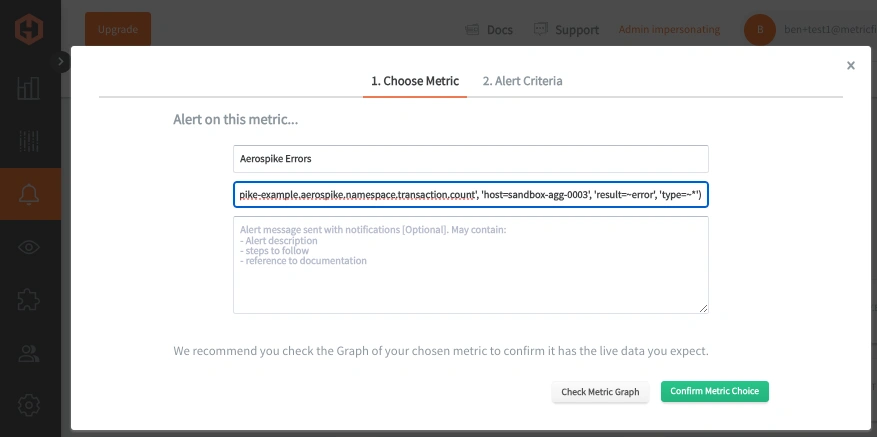
Then, select the Alert Criteria tab to set a threshold and select a notification channel. The default notification channel will be the email you used to sign up for the Hosted Graphite account. Still, you can easily configure channels for Slack, PagerDuty, Microsoft Teams, OpsGenie, custom webhooks and more. See the Hosted Graphite Notification Channels docs for more details:
Conclusion
Aerospike is a blazing-fast database built for high-throughput, low-latency workloads. But even the fastest databases need visibility, and that’s where OpenTelemetry shines by giving you real-time insights, performance metrics, and early warnings before issues escalate. In the end, monitoring your database isn’t just nice to have—it’s what keeps your apps fast, your users happy, and your business running smoothly.
Sign up for the free trial and begin monitoring your infrastructure today. You can also book a demo and talk to the MetricFire team directly about your monitoring needs.