Table of Contents
Great systems are not just built. They are monitored.
MetricFire runs Graphite and Grafana as a fully managed service for growing engineering teams, taking care of storage, scaling, and version updates so your team doesn't have to. Plans start at $19/month, billed per metric namespace rather than per host, and include engineer-staffed support. Integrations work natively with Heroku, AWS, Azure, and GCP, and data is stored with 3× redundancy in SOC2- and ISO:27001-certified data centres.
Introduction
When you're running a Java application, the JVM is doing a ton of work behind the scenes but unless you're monitoring those internals, it's hard to know how your app is really performing. JVM metrics give you a window into the heart of the runtime: how much memory you're using, how often garbage collection is kicking in, how many threads are active, and where potential bottlenecks might be hiding. Whether you're debugging performance issues or just want better visibility into your Java workloads, collecting JVM metrics is a must have!
In this article, we'll explain how to configure the OpenTelemetry Collector to scrape and export JVM metrics to a Hosted Carbon endpoint.
Getting Started With a Java Application
This guide assumes you already have a Java app to monitor but if not, here’s a quick way to stand one up on Linux so you can try it out.
Install OpenJDK (ubuntu)
sudo apt update
sudo apt install openjdk-17-jdk -y
java --version
Create a Simple Java App
Create a Java file named JMXTestApplication.java and add the following, to produce some jvm metrics:
import java.lang.management.ManagementFactory;
import javax.management.*;

public class JMXTestApplication {
    public static void main(String[] args) throws Exception {
        MBeanServer mBeanServer = ManagementFactory.getPlatformMBeanServer();

        ObjectName objectName = new ObjectName("com.example:type=JMXTest");
        mBeanServer.registerMBean(new JMXTest(), objectName);

        System.out.println("JMX Test Application is running. Press Ctrl+C to exit.");
        Thread.sleep(Long.MAX_VALUE); // Keep running indefinitely
    }
}

interface JMXTestMBean {
    int getCounter();
    void increment();
}

class JMXTest implements JMXTestMBean {
    private int counter = 0;

    public int getCounter() {
        return counter;
    }

    public void increment() {
        counter++;
    }
}
Create a Manifest File
The manifest file is needed in this configuration because you're creating a self-contained executable JAR file that needs to know which class contains the main() method to start your application.
Create a new file named MANIFEST.MF that contains the following:
Manifest-Version: 1.0
Main-Class: JMXTestApplication
create interface file: JMXTestMBean.java
public interface JMXTestMBean {
    int getCounter();
    void increment();
}
Compile the Java Files
You need to compile the .java files with javac to turn them into .class files, which contain the bytecode the JVM can actually run.
javac JMXTestMBean.java JMXTestApplication.java
Create the JAR
You make it easier to launch the app, you must create the JAR to package all compiled .class files, and the manifest into a single, runnable file.
jar cfm JMXTestApplication.jar MANIFEST.MF JMXTestApplication.class JMXTest.class JMXTestMBean.class
Verify the JAR:
jar tf JMXTestApplication.jar
Serve the Test App
Run the java app and force it to bind to IPv4 and OTLP export disabled. These JVM options ensure reliable JMX connectivity and allow OpenTelemetry to scrape metrics without authentication or SSL. Disabling OTLP export and forcing IPv4 prevents unnecessary telemetry traffic and avoids binding issues with IPv6.
java \
  -Djava.net.preferIPv4Stack=true \
  -Djava.rmi.server.hostname=127.0.0.1 \
  -Dcom.sun.management.jmxremote \
  -Dcom.sun.management.jmxremote.port=9999 \
  -Dcom.sun.management.jmxremote.rmi.port=9999 \
  -Dcom.sun.management.jmxremote.local.only=false \
  -Dcom.sun.management.jmxremote.authenticate=false \
  -Dcom.sun.management.jmxremote.ssl=false \
  -jar JMXTestApplication.jar
You can leave your Java app running and open another terminal to continue the next steps of installing the JMX collector, and setting up OpenTelemetry with the JMX Receiver.
Install the JMX Metrics JAR
The opentelemetry-jmx-metrics.jar is what actually knows how to talk to the JVM and pull out useful metrics like memory usage, thread count, and garbage collection. Without it, the OpenTelemetry Collector’s JMX Receiver wouldn’t know what to collect or how to scrape it. You can install it with the following command:
wget -O /etc/otelcol-contrib/opentelemetry-jmx-metrics.jar "https://github.com/open-telemetry/opentelemetry-java-contrib/releases/download/v1.43.0/opentelemetry-jmx-metrics.jar"
Confirm that the file exists:
ls -lh /etc/otelcol-contrib/opentelemetry-jmx-metrics.jar
Grant permissions:
sudo chmod 644 /etc/otelcol-contrib/opentelemetry-jmx-metrics.jar
Install and Configure OpenTelemetry
OpenTelemetry as a Collector has built-in support for NGINX, PostgreSQL, Redis, RabbitMQ, Kubernetes, Elasticsearch, and many more! These Receivers pull key performance metrics directly from your services—no manual parsing or custom scripts needed. This article assumes you already use OpenTelemetry, but below are examples of how to install and configure otelcol-contrib to quickly collect system metrics and export them to a Carbon endpoint.
Install OpenTelemetry Collector Contrib (Linux)
/etc/otelcol-contrib/Ubuntu/Debian (AMD)
wget https://github.com/open-telemetry/opentelemetry-collector-releases/releases/download/v0.119.0/otelcol-contrib_0.119.0_linux_amd64.deb

sudo dpkg -i otelcol-contrib_0.119.0_linux_amd64.deb
RedHat/CentOS (AMD)
wget https://github.com/open-telemetry/opentelemetry-collector-releases/releases/download/v0.119.0/otelcol-contrib_0.119.0_linux_amd64.rpm

sudo rpm -ivh otelcol-contrib_0.119.0_linux_amd64.rpm
Confirm the Installation
otelcol-contrib --version
Configure the JMX Receiver and Carbon Exporter
The JMX Receiver in OpenTelemetry collects metrics from localhost:9999, processes them, and forwards them to your exporter of choice.
The Carbon Exporter takes those metrics and ships them straight to Graphite-compatible backends, making it easy to integrate OpenTelemetry with minimal setup.
If you're not currently hosting your own Graphite data source, start a 14-day free trial with Hosted Graphite by MetricFire to continue following along with this example. A MetricFire account will provide the Graphite data source and include Hosted Grafana as a visualization tool - along with Alerting, Integrations, and Team features.
- First, find the OTel configuration file generally located at: /etc/otelcol-contrib/config.yaml and open it in your preferred text editor.
- Then you can either replace the file, or add the following sections to your current config.
- Be sure to include your HG-API-KEY and HOSTNAME.
receivers:
 jmx:
  jar_path: "/etc/otelcol-contrib/opentelemetry-jmx-metrics.jar"
  endpoint: "service:jmx:rmi:///jndi/rmi://localhost:9999/jmxrmi"
  target_system: "jvm"

processors:
  batch: {}
  metricstransform:
    transforms:
      - include: ".*"
        match_type: regexp
        action: update
        new_name: "<HG-API-KEY>.opentel.$$0"
        operations:
          - action: add_label
            new_label: host
            new_value: <HOSTNAME>

exporters:
  carbon:
    endpoint: "carbon.hostedgraphite.com:2003"
    timeout: 10s

service:
  pipelines:
    metrics:
      receivers:
        - jmx
      processors:
        - batch
        - metricstransform
      exporters:
        - carbon
Now, just save the file and restart the otelcol-contrib service:
sudo systemctl restart otelcol-contrib
sudo systemctl status otelcol-contrib
Or you can server the file manually - to troubleshoot potential configuration errors:
otelcol-contrib --config /etc/otelcol-contrib/config.yaml
Ship Tagged Graphite Metrics
Within two minutes of restarting the otelcol-contrib service, a set of Tagged Graphite metrics will be forwarded to your Hosted Graphite account (with the opentel.jvm prefix).
Why does OpenTelemetry export Tagged metrics to Carbon?
- Because it's core model aligns more with Prometheus-style 'labels' than Graphite's 'dot notation' formatting. Instead of flattening data into long metric names, it preserves the labels by using Graphite tags, which enables richer filtering in your Graphite backend.
Now you can locate these Tagged Metrics in the Hosted Graphite Tag Search UI - under the host tag:
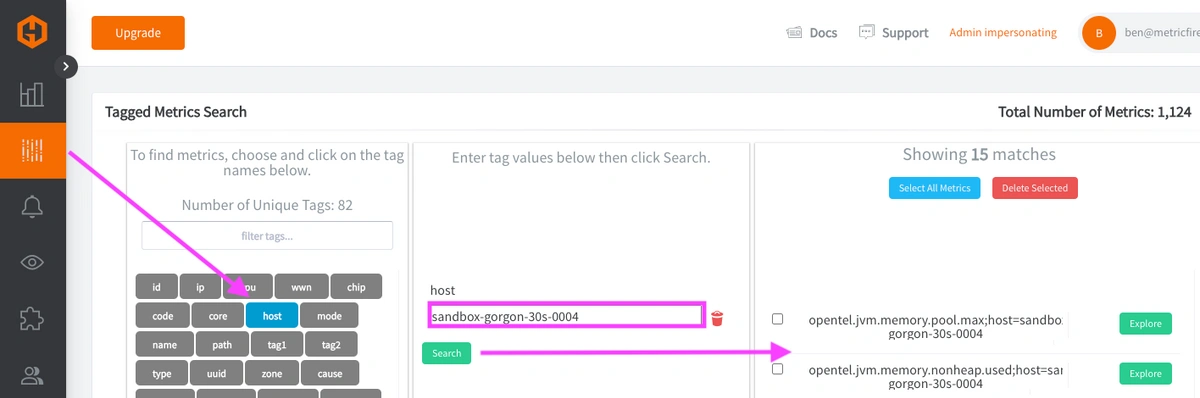
Otherwise, you can configure a different exporter to forward metrics to another data source.
JMX Receiver VS Prometheus Receiver
Both the OpenTelemetry's JMX Receiver and Prometheus Receiver (using the jmx_exporter agent) can collect JVM metrics - but the experience can be slightly different for each. The JMX Receiver configuration in this article requires you to open a remote JMX port, deal with extra JVM flags, and install the opentelemetry-jmx-metrics.jar. It works fine but there is another option...using the OTel Prometheus Receiver.
The Prometheus approach is pretty lightweight because you just drop the jmx_exporter agent into your startup command, point it to a config file, and you're done - with no extra ports and no separate jars to worry about. So if you need a quick, clean, and production-friendly way to monitor Java apps, the Prometheus Receiver + JMX agent combo is often the smoother path. In our testing, the Prometheus/JMX configuration also produced more metrics than the JMX Receiver, giving us additional insight into our app's performance. See our related blog article HERE if you're interested in learning more about configuring the OTel Prometheus Receiver to monitor your Java app.
Use Hosted Graphite by MetricFire to Create Custom Dashboards and Alerts
MetricFire is a monitoring platform that enables you to gather, visualize and analyze metrics and data from servers, databases, networks, processes, devices, and applications. Using MetricFire, you can effortlessly identify problems and optimize resources within your infrastructure. Hosted Graphite by MetricFire removes the burden of self-hosting your monitoring solution, allowing you more time and freedom to work on your most important tasks.
Metrics sent to the public carbon endpoint will be timestamped, and aggregated into the Hosted Graphite backend.
-
OpenTelemetry metrics will be sent and stored in the Graphite Tag format of: my.series;tag1=value1;tag2=value2 metric_value (timestamp)
-
The tags provide a filtering option, making the metrics efficient to query
-
Metrics are stored in your Hosted Graphite account for two years, and you can use them to create custom Dashboards and Alerts.
Build Custom Dashboards in MetricFire's Hosted Grafana
In the Hosted Graphite UI, navigate to Dashboards and select + New Dashboard to create a new visualization.
Then go into Edit mode and use the Query UI to select a graphite metric path (the default data source will be HostedGraphite if you are accessing Grafana via your HG account).
NOTE: To query Tagged metrics, you must apply the seriesByTag Graphite function - the alias() function is optional but makes your metric names more readable on the graph.

Grafana has many additional options to apply different visualizations, modify the display, set units of measurement, and some more advanced features like configuring dashboard variables and event annotations.
Here's an example of a dashboard that was built using JMX => OTel => Graphite metrics:
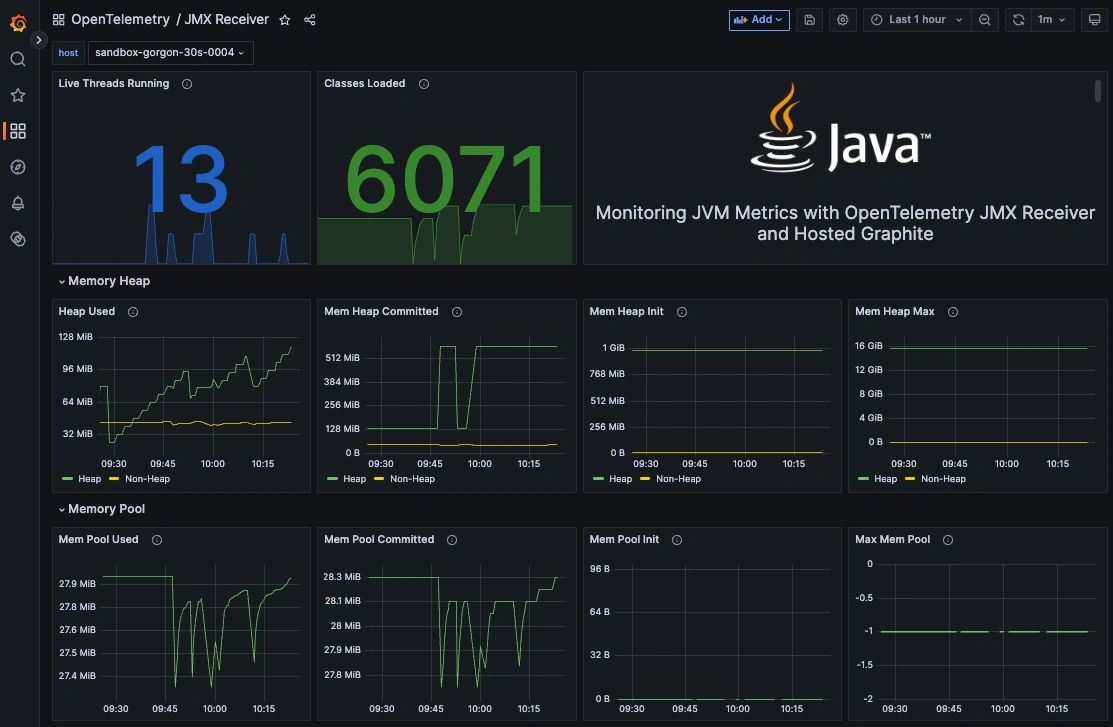
See the Hosted Graphite Dashboard docs for more details around building custom Grafana visualizations.
Creating Graphite Alerts
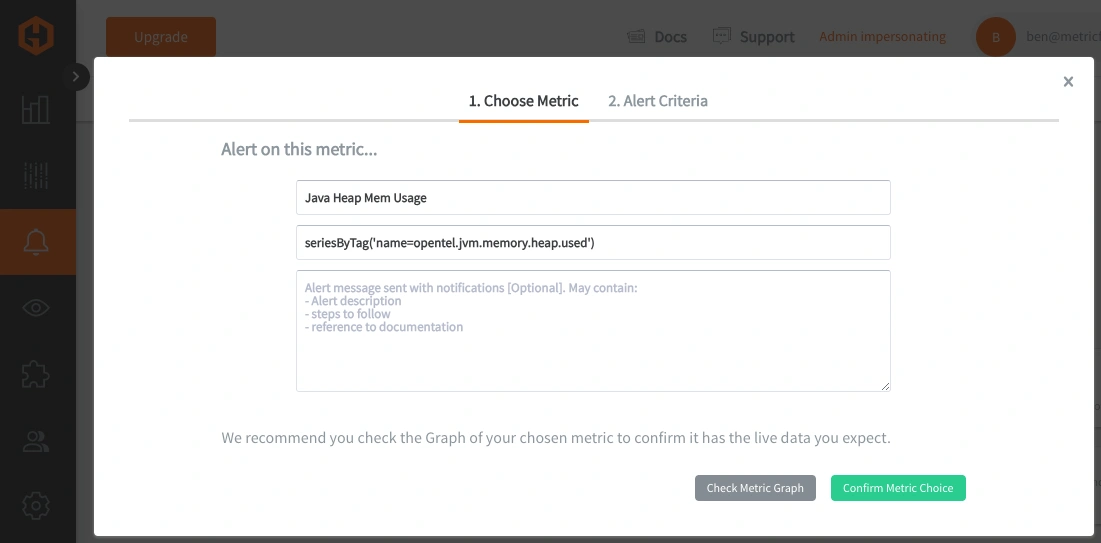
In the Hosted Graphite UI, navigate to Alerts => Graphite Alerts to create a new alert. Name the alert, add your Tagged JVM Metric to the alerting metric field, and add a description of what this alert is:
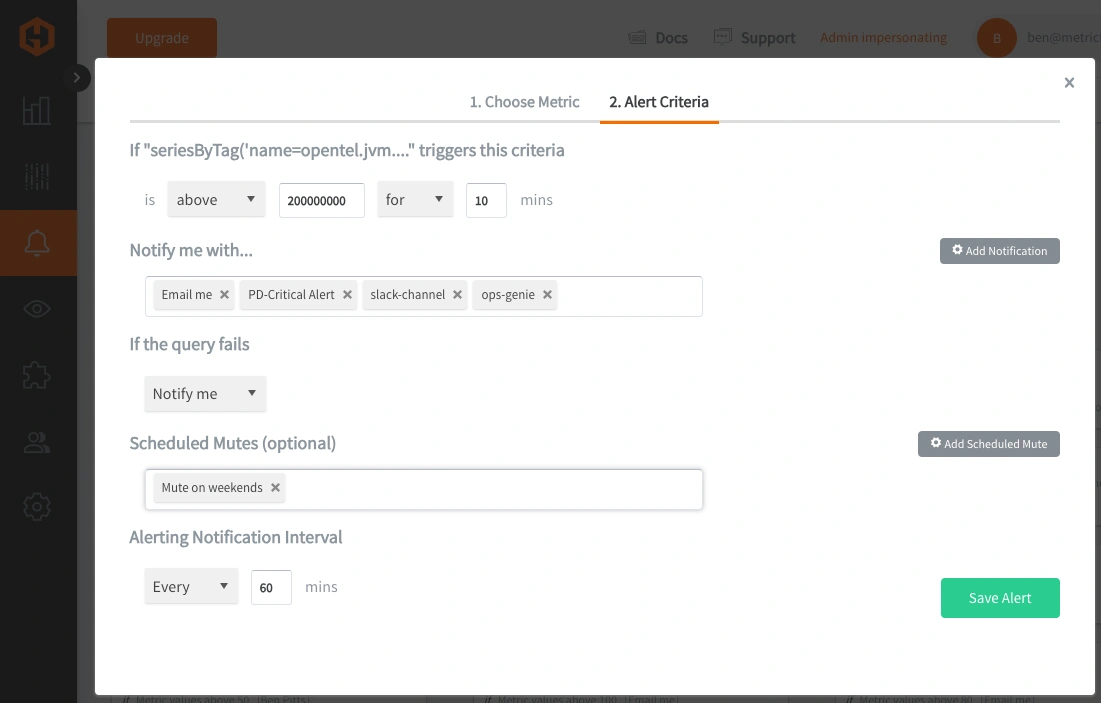
Then, select the Alert Criteria tab to set a threshold and select a notification channel. The default notification channel will be the email you used to sign up for the Hosted Graphite account. Still, you can easily configure channels for Slack, PagerDuty, Microsoft Teams, OpsGenie, custom webhooks and more. See the Hosted Graphite Notification Channels docs for more details:
Conclusion
Monitoring the performance of your Java app isn’t just a nice-to-have - it’s how you catch problems before your users do. By keeping an eye on things like memory usage, thread count, and garbage collection, you get real-time insights into how your app is behaving under the hood. This helps you prevent slowdowns, crashes, and unexpected outages which ultimately protects your user experience, your team’s sanity, and your bottom line.
Sign up for the free trial and begin monitoring your infrastructure today. You can also book a demo and talk to the MetricFire team directly about your monitoring needs.