Table of Contents
Great systems are not just built. They are monitored.
MetricFire runs Graphite and Grafana as a fully managed service for small engineering teams, taking care of storage, scaling, and version updates so your team doesn't have to. Plans start at $19/month, billed per metric namespace rather than per host, and include engineer-staffed support. Integrations work natively with Heroku, AWS, Azure, and GCP, and data is stored with 3× redundancy in SOC2- and ISO:27001-certified data centres.
Introduction
In this article, we'll explore another monitoring use case. This particular use case is exciting– it's MetricFire's use case with Kubernetes and Linode! We'll examine how our company uses our platform to monitor our K8s clusters hosted on Linode. Let's get started!
Why MetricFire Uses Linode-based K8s
MetricFire offers a hosted monitoring solution based on hosted Graphite and Grafana for complete data ingestion and visualization. (Give our platform a test run to see for yourself!)
We recently completed upgrading our users' Hosted Grafana environment. The process can be tedious, and deploying the new version of Grafana to each account would take a significant amount of time.
We decided to move our Grafana infrastructure to Linode, a hosted K8s, so that we could better manage each customer's account. This has made Grafana management more manageable and given customers more options for customizing their individual Grafana instances.
The Importance of Monitoring K8s and Linode
We built our managed K8 environment on Linode to host all customer Grafana instances and databases.
While our newly hosted Grafana environment was in BETA, pods occasionally died, making deployments complicated. We weren't sure why this was happening, but our team realized that this was another great situation to eat our dog food, so we set up monitoring for our Linode clusters.
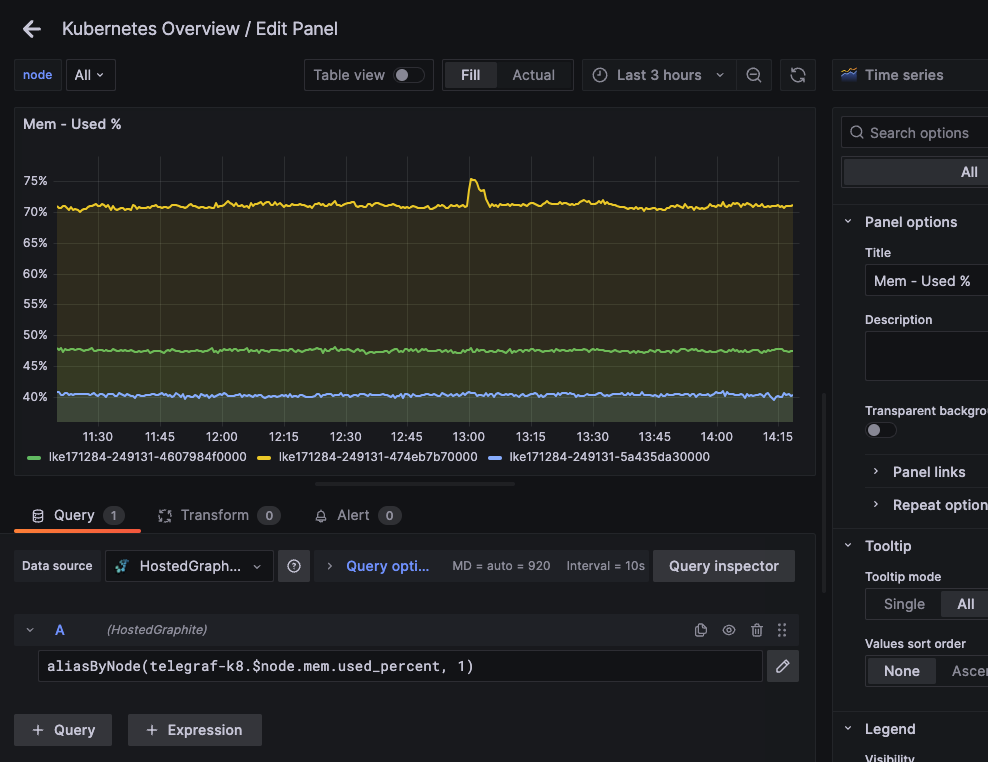
Once we had node/container performance monitoring in place, we could see that more RAM was used than we expected. Knowing this gave us crucial information on how much to scale up our node resources, thus fixing our issue. We no longer have pods dying, and we've been able to have much more insight into this upgrade to our platform.
How We Monitor K8s and Linode with MetricFire
Because we knew the perfect solution, we first signed into our MetricFire account (which you can do here).
Next, we configured a Telegraf daemonset for our K8 clusters. We deployed the Telegraf daemon into our context and forwarded performance metrics to our HG account. It was that simple!
You can also accomplish this by cloning the telegraf-daemonset repository from the MetricFire GitHub and configuring it with your Hosted Graphite API key to quickly and easily monitor your K8 environment.
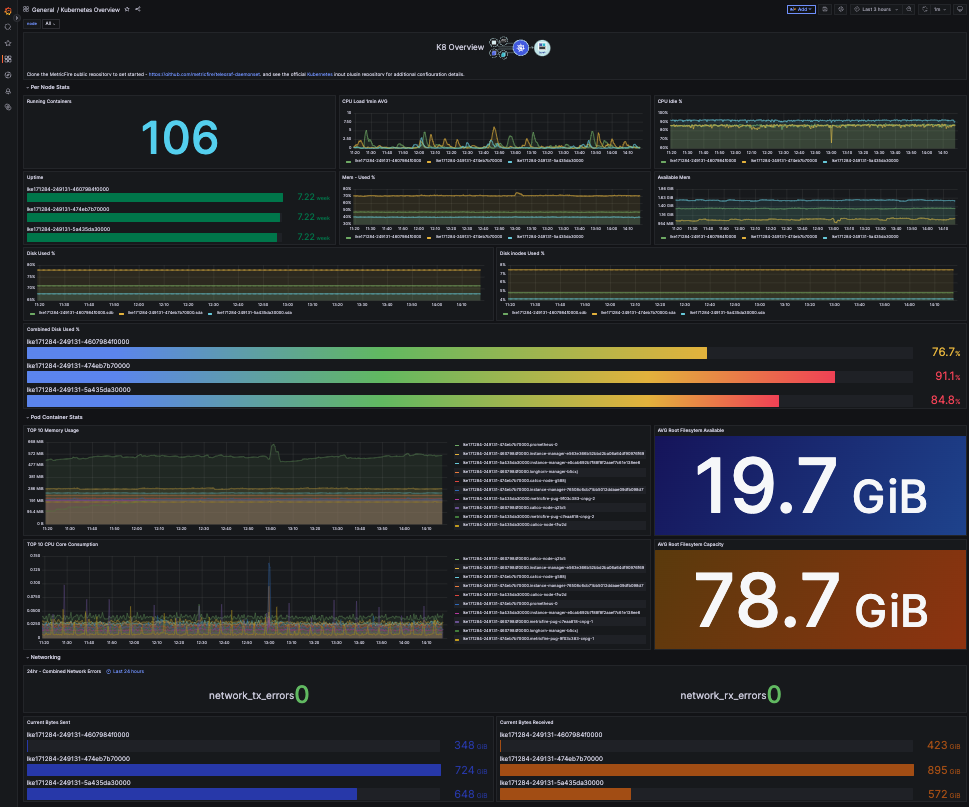
If you are following along and are interested in learning more about MetricFire's capabilities, you can go to the Dashboard Library in your HG account and generate the pre-made K8 Overview dashboard.
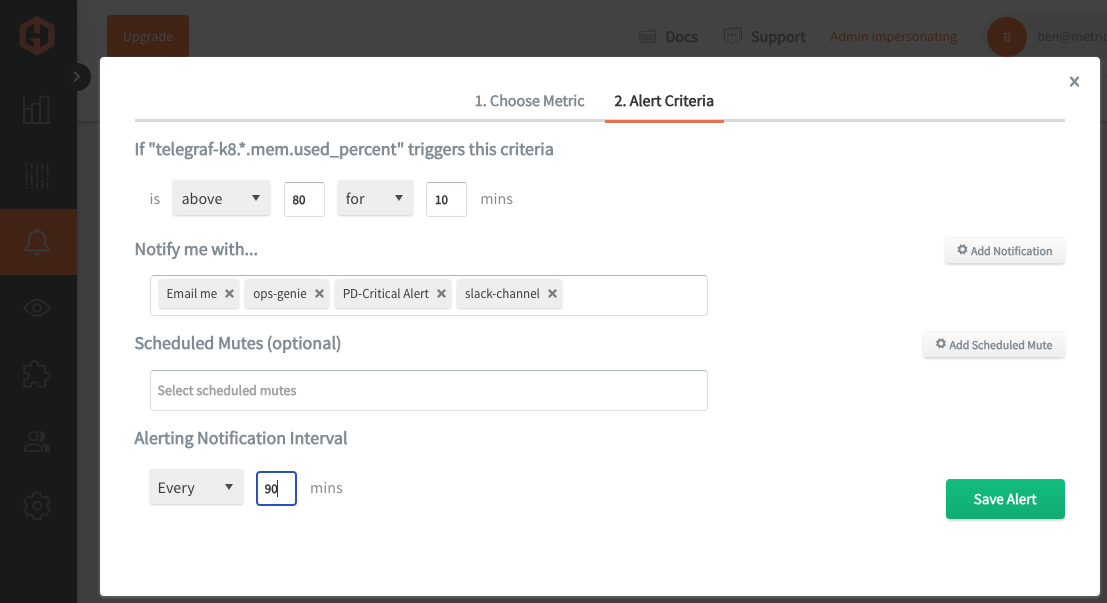
You can create custom alerts to your preferred channel when your K8 cluster performance exceeds expected bounds.
How our K8s and Linode plugin can Help You
Using MetricFire to monitor your K8s clusters is not only effective but also remarkably easy, giving you the confidence to manage your clusters efficiently.
MetricFire is not just a monitoring tool; it's a comprehensive solution that provides you with all the necessary visibility and control. Unlike command-line tools like K9s and Lens, which can leave you with limited visibility.
MetricFire ensures you're always well-equipped to manage your K8s clusters. With MetricFire, you're not alone in your monitoring journey. While other solutions like Prometheus may leave you struggling with a steep learning curve, MetricFire offers two years of data retention.
Plain and simple, Hosted Graphite has an experienced, dedicated support team that is ready to guide you through any questions or challenges with seeing the metrics most important to you.
Conclusion
Monitoring Kubernetes can be complicated. Setting up and managing your clusters and learning how it works takes considerable time and effort.
It can be impossible to get started if you're using tools like Prometheus, which requires a deep understanding to fully leverage.
With MetricFire, you can bypass much of the complexity and get straight to effective monitoring, freeing up your time to focus on what truly matters—growing your business. So, instead of spending countless hours trying to learn and implement Kubernetes monitoring, let MetricFire handle it for you.