Table of Contents
- Introduction
- Understanding the Importance of Observability in Snowflake
- Step 1: Getting Started With Snowflake
- Step 2: Install and Configure OpenTelemetry
- Step 3: Use Hosted Graphite by MetricFire to Create Custom Dashboards and Alerts
- Best Practices for Effective Monitoring
- Conclusion
Great systems are not just built. They are monitored.
MetricFire is the fully managed Graphite and Grafana platform for small teams that don’t want to self-host their monitoring stack. Pre-built dashboards, alerts, and native add-ons for Heroku, AWS, Azure, and GCP. All with dedicated support and no infrastructure to maintain.
Introduction
Snowflake is a powerful, cloud-based data platform designed for high-performance analytics. Whether you're running massive analytical queries, managing structured and semi-structured data, or optimizing data pipelines, visibility into your Snowflake instance is essential. Performance bottlenecks, query execution delays, and unexpected cost spikes can quickly become issues without proper monitoring.
Snowflake has revolutionized data warehousing by offering a scalable, cloud-native platform that separates storage and compute resources. As organizations increasingly rely on Snowflake for critical analytics workloads, ensuring optimal performance and reliability becomes paramount. Integrating OpenTelemetry (OTel) into your Snowflake environment provides deep visibility into system behavior, enabling proactive monitoring and troubleshooting.
This guide walks you through integrating OpenTelemetry (contrib) with Snowflake to gain enhanced visibility into query performance, execution times, queuing, storage utilization, and billing impact. We’ll set up an OpenTelemetry Collector to scrape Snowflake metrics, configure an endpoint for exporting data, and troubleshoot common pitfalls. By the end, you’ll have a scalable, automated monitoring setup for Snowflake that provides actionable insights into how your queries and resources are performing.
Understanding the Importance of Observability in Snowflake
Observability extends beyond traditional monitoring by providing insights into the internal states of systems through metrics, logs, and traces. In the context of Snowflake:
-
Metrics: Quantitative data points like query execution times, warehouse load, and storage usage.
-
Logs: Detailed records of events, errors, and system messages.
-
Traces: End-to-end tracking of requests as they propagate through various components.
Implementing observability allows teams to:
-
Identify performance bottlenecks.
-
Understand system behavior under different workloads.
-
Quickly detect and resolve issues.
Step 1: Getting Started With Snowflake
If you're already running a Snowflake instance in your production or test environment, you can jump straight to the OTel configuration section. Otherwise, the next section provides a quick setup guide to configure a free Snowflake trial account with their CLI tool - for testing purposes.
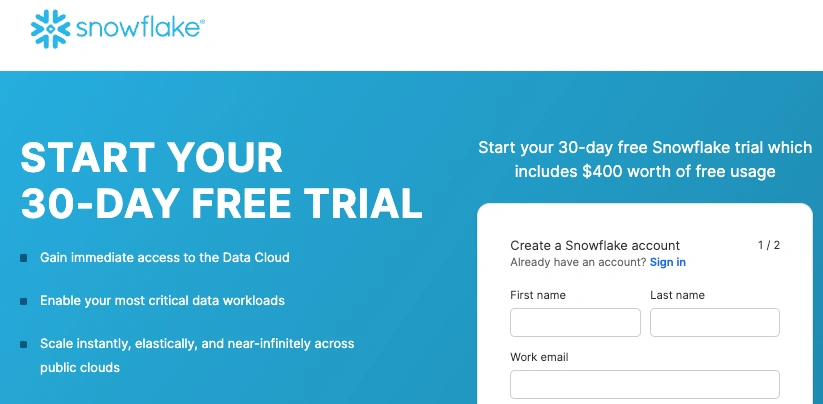
Create a Free Snowflake Trial Account
Snowflake offers a 30-day free trial with free credits to spin up a warehouse, execute queries, and analyze performance. Create a trial account HERE, and once logged on, grab your account URL (you’ll need this later):
Install the Snowflake CLI (Linux)
The Snowflake CLI (snow) provides a command-line interface for running queries, managing users, and handling warehouse configurations from within your server environment. You can find their CLI installation docs HERE, but using Python's pip package manager is also an easy option:
pip3 install snowflake-cli
Add SnowSQL to Your System PATH
By default, snow is installed in ~/.local/bin/. We’ll add this directory to the system PATH in your server so you can call snow from anywhere (bash).
export PATH=$HOME/.local/bin:$PATH
echo 'export PATH=$HOME/.local/bin:$PATH' >> ~/.bashrc
source ~/.bashrc
Now you can verify the version:
snow --version
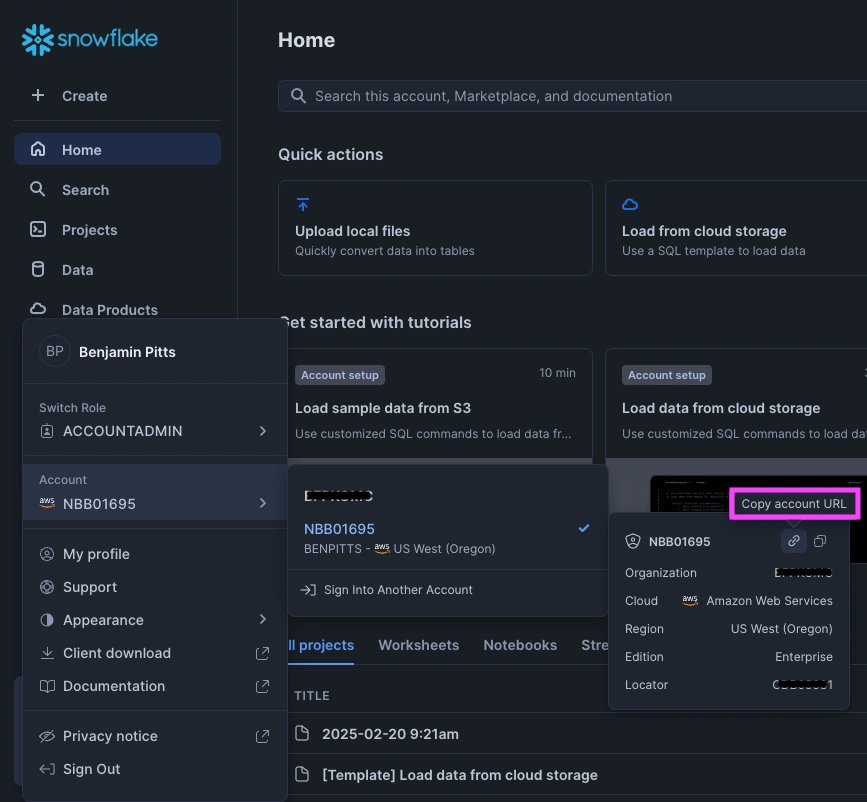
Locate your Snowflake URL
Your Snowflake account URL is required for CLI authentication and OTel configuration. This can be found in your trial account settings (bottom-left corner):
Then you can test your server connection to the Snowflake account with a similar SQL query:
snow sql --account <account-name> --user <user-name> -q "SHOW WAREHOUSES;"
Set Up a Snowflake Connection in your Server
Instead of entering credentials manually every time, you can create a persistent connection profile. Be sure to set the account (locator) and username options, which can be found in your Snowflake account UI:
snow connection add --accountname <account-name> --username <username>
- It will prompt you to define several connection parameters. Most of them are optional, but Name, Password, and Warehouse are required.
- Password (this is the PW for your trial account), Warehouse (default: COMPUTE_WH).
- You can skip optional fields, such as region, schema, or TLS settings.
Now you can verify that the connection was created successfully, and set it as your default connection:
snow connection list

snow connection set-default <connection-name>
Create a Sample Database & Table
For testing purposes, you can create a sample sales dataset from within your server:
snow sql --connection <connection-name> -q "
CREATE OR REPLACE TABLE MY_TEST_DB.PUBLIC.sales_data (
    sale_id INT AUTOINCREMENT PRIMARY KEY,
    sale_date TIMESTAMP DEFAULT CURRENT_TIMESTAMP,
    customer_name STRING,
    product_name STRING,
    quantity INT,
    price DECIMAL(10,2)
);"

snow sql --connection <connection-name> -q "
INSERT INTO MY_TEST_DB.PUBLIC.sales_data (customer_name, product_name, quantity, price) VALUES
    ('Alice Johnson', 'Laptop', 1, 1200.00),
    ('John Smith', 'Keyboard', 2, 45.00),
    ('Emily Brown', 'Monitor', 1, 250.00);"
Then you can verify that the DB/Table was created successfully by running a couple of snow sql example queries:
snow sql --connection <connection-name> -q "
SELECT COUNT(*) FROM MY_TEST_DB.PUBLIC.sales_data;"
snow sql --connection <connection-name> -q "
SELECT SUM(quantity * price) AS total_revenue
FROM MY_TEST_DB.PUBLIC.sales_data;"
Step 2: Install and Configure OpenTelemetry
OpenTelemetry, as a Collector, has built-in Receiver plugins for HAProxy, NGINX, PostgreSQL, Redis, MongoDB, Kafka, Elasticsearch, RabbitMQ, and many more. These Receivers pull key performance metrics directly from your services with no manual parsing or custom scripts needed. This article assumes you're already using OpenTelemetry in your technology stack, but below are examples of how to install and configure otelcol-contrib to collect system-level metrics and export them to a storage endpoint.
Install OpenTelemetry Collector Contrib (Linux)
/etc/otelcol-contrib/Ubuntu/Debian (AMD)
wget https://github.com/open-telemetry/opentelemetry-collector-releases/releases/download/v0.119.0/otelcol-contrib_0.119.0_linux_amd64.deb

sudo dpkg -i otelcol-contrib_0.119.0_linux_amd64.deb
RedHat/CentOS (AMD)
wget https://github.com/open-telemetry/opentelemetry-collector-releases/releases/download/v0.119.0/otelcol-contrib_0.119.0_linux_amd64.rpm

sudo rpm -ivh otelcol-contrib_0.119.0_linux_amd64.rpm
Confirm Installation
otelcol-contrib --version
Configure the Snowflake Receiver and Carbon Exporter
The Snowflake Receiver in OpenTelemetry collects DB performance metrics, processes them, and forwards them to your exporter of choice.
The Carbon Exporter takes those metrics and ships them straight to Graphite-compatible backends, making it easy to integrate OTel into existing monitoring stacks with minimal setup.
If you're not currently hosting your own Graphite data source, start a 14-day free trial with Hosted Graphite by MetricFire to continue following along with this example!
A MetricFire account will provide the Graphite data source and include Hosted Grafana as a visualization tool - along with robust Alerting, Integrations, and Team features.
- First, find the configuration file generally located at: /etc/otelcol-contrib/config.yaml and open it in your preferred text editor.
- Then you can either replace the file or add the following sections to your current config.
- Be sure to include your Snowflake account credentials, HG-API-KEY, and server HOSTNAME.
receivers:
  snowflake:
    account: "<account-name>"
    username: "<user-name>"
    password: "<account-password>"
    warehouse: "COMPUTE_WH"
    metrics:
      snowflake.billing.cloud_service.total: { enabled: true }
      snowflake.billing.total_credit.total: { enabled: true }
      snowflake.billing.virtual_warehouse.total: { enabled: true }
      snowflake.billing.warehouse.cloud_service.total: { enabled: true }
      snowflake.billing.warehouse.total_credit.total: { enabled: true }
      snowflake.billing.warehouse.virtual_warehouse.total: { enabled: true }
      snowflake.logins.total: { enabled: true }
      snowflake.pipe.credits_used.total: { enabled: true }
      snowflake.query.bytes_spilled.local.avg: { enabled: true }
      snowflake.query.bytes_spilled.remote.avg: { enabled: true }
      snowflake.query.data_scanned_cache.avg: { enabled: true }
      snowflake.query.partitions_scanned.avg: { enabled: true }
      snowflake.rows_deleted.avg: { enabled: true }
      snowflake.rows_inserted.avg: { enabled: true }
      snowflake.rows_produced.avg: { enabled: true }
      snowflake.rows_unloaded.avg: { enabled: true }
      snowflake.rows_updated.avg: { enabled: true }
      snowflake.session_id.count: { enabled: true }
      snowflake.storage.failsafe_bytes.total: { enabled: true }

processors:
  batch: {}

  metricstransform:
    transforms:
      - include: ".*"
        match_type: regexp
        action: update
        new_name: "<HG-API-KEY>.opentel.$$0"
        operations:
          - action: add_label
            new_label: host
            new_value: <HOSTNAME>

exporters:
  carbon:
    endpoint: "carbon.hostedgraphite.com:2003"
    timeout: 10s

service:
  pipelines:
    metrics:
      receivers:
        - snowflake
      processors:
        - batch
        - metricstransform
      exporters:
        - carbon
Now, just save the file and restart the otelcol-contrib service:
sudo systemctl restart otelcol-contrib
sudo systemctl status otelcol-contrib
Or you can server the file manually - to troubleshoot potential configuration errors:
otelcol-contrib --config /etc/otelcol-contrib/config.yaml
Confirm that snowflake metrics are being collected at the default metric endpoint (at port 8888):
curl http://localhost:8888/metrics | grep snowflake
Considerations:
- The above config.yaml file enables all Optional Metrics, as defined in the OTel Snowflake Receiver docs.
- Snowflake aggregates their data into 24-hour buckets, so certain metric values won't update instantly.
Ship Tagged Graphite Metrics
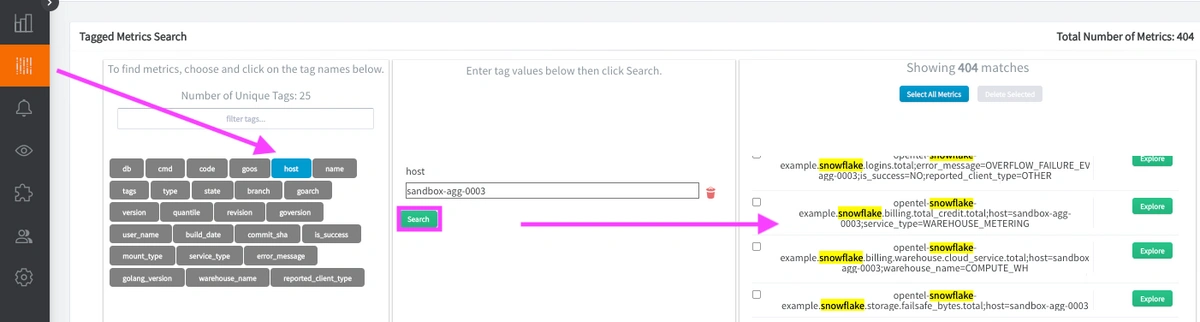
Within two minutes of restarting the otelcol-contrib service, a set of Tagged Graphite metrics will be forwarded to your Hosted Graphite account (with the opentel.snowflake prefix).
Why does OpenTelemetry export Tagged metrics to Carbon?
- "Because it's core model aligns more with Prometheus-style 'labels' than Graphite's 'dot notation' formatting. Instead of flattening data into long metric names, it preserves the labels by using Graphite tags, which also enables richer filtering in your Graphite backend."
Now you can locate these Tagged Metrics in the Hosted Graphite Tag Search UI - under the host tag:
Otherwise, you can configure a different exporter to forward metrics to another data source.
Step 3: Use Hosted Graphite by MetricFire to Create Custom Dashboards and Alerts
Hosted Graphite by MetricFire is a monitoring platform that enables you to gather, visualize and analyze metrics and data from servers, databases, networks, processes, devices, and applications. Using MetricFire, you can effortlessly identify problems and optimize resources within your infrastructure.
Metrics sent to the public carbon endpoint will be timestamped and aggregated into the Hosted Graphite backend.
-
OpenTelemetry metrics will be sent and stored in the Graphite Tag format of: my.series;tag1=value1;tag2=value2 metric_value (timestamp)
-
The tags provide a filtering option, making the metrics efficient for the query.
-
Metrics are stored in your Hosted Graphite account for two years, and you can use them to create custom Dashboards and Alerts.
Build Custom Dashboards in MetricFire's Hosted Grafana
In the Hosted Graphite UI, navigate to Dashboards and select + New Dashboard to create a new visualization.
Then, go into Edit mode and use the Query UI to select a graphite metric path (the default data source will be HostedGraphite if you are accessing Grafana via your HG account).
NOTE: To query Tagged metrics, you must apply the seriesByTag Graphite function - the aliasByTags function is optional but useful for making the metric names more readable.
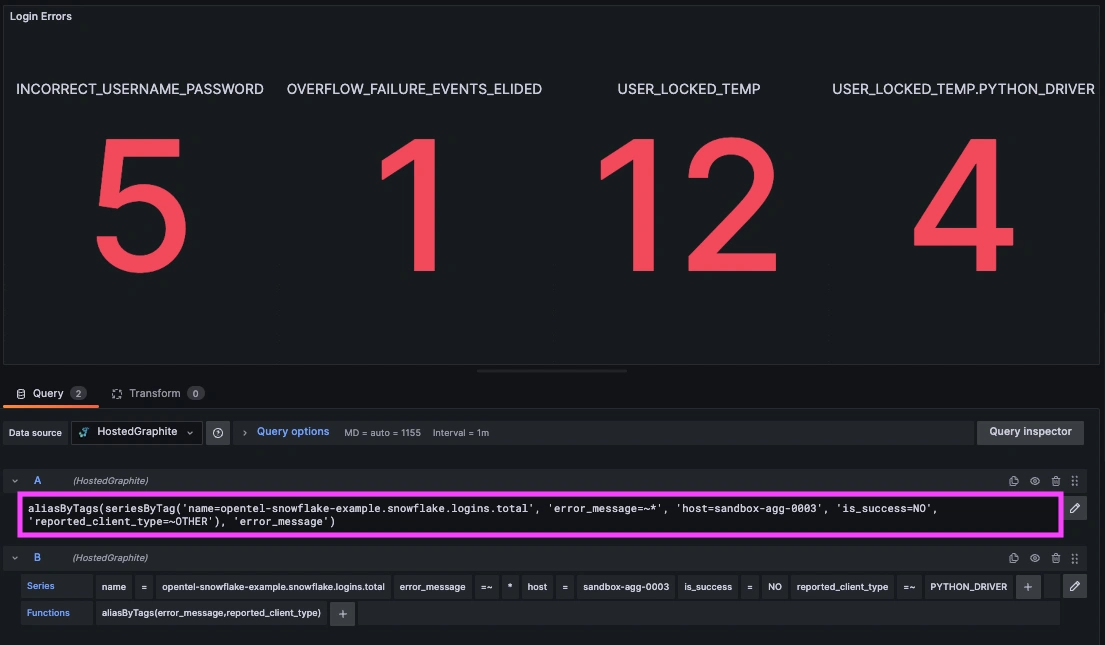
Grafana offers numerous additional options, including various visualisations, display customisation, unit of measurement settings, and more advanced features such as configuring dashboard variables and event annotations. Here is an example of a production-level dashboard that uses metrics collected by the OTel Snowflake Receiver:
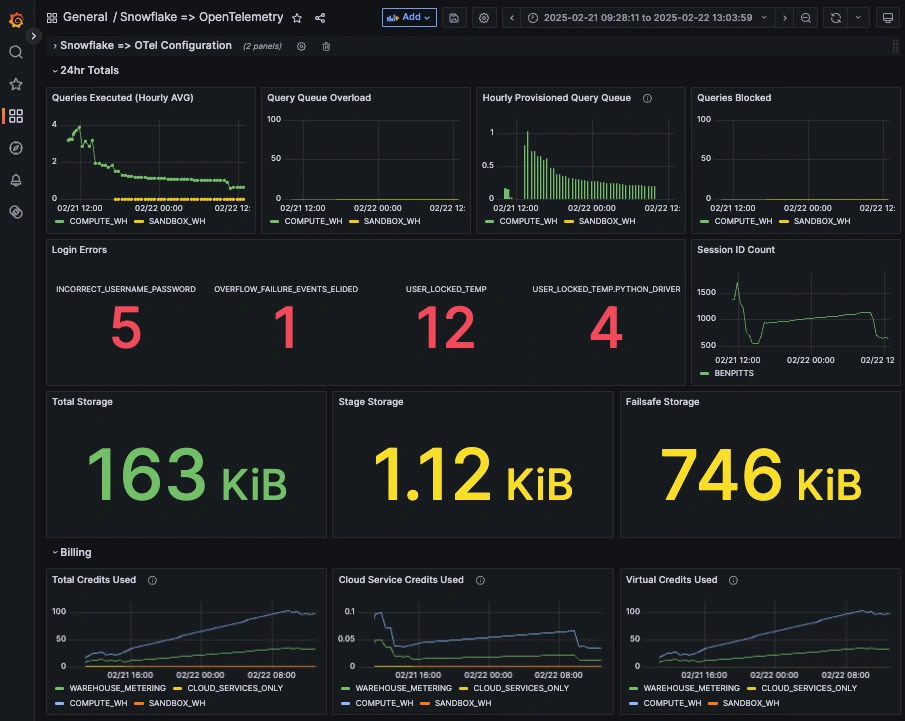
See the Hosted Graphite Dashboard docs for more details about building custom Grafana visualizations.
Creating Graphite Alerts
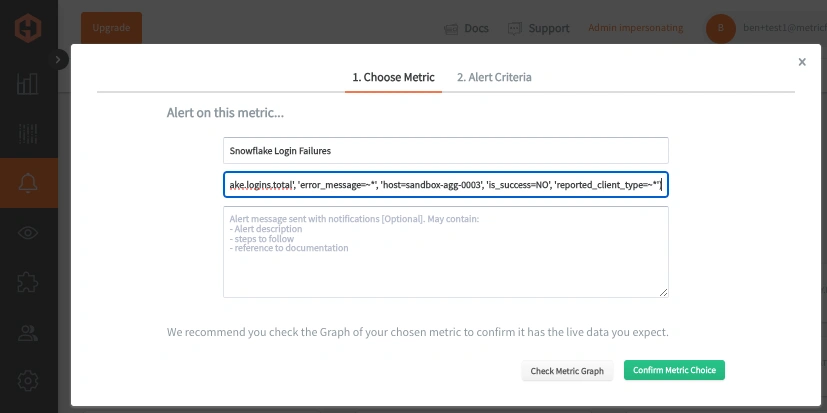
In the Hosted Graphite UI, navigate to Alerts => Graphite Alerts to create a new alert. Name the alert and add a Tagged Snowflake Metric to the alerting metric field:
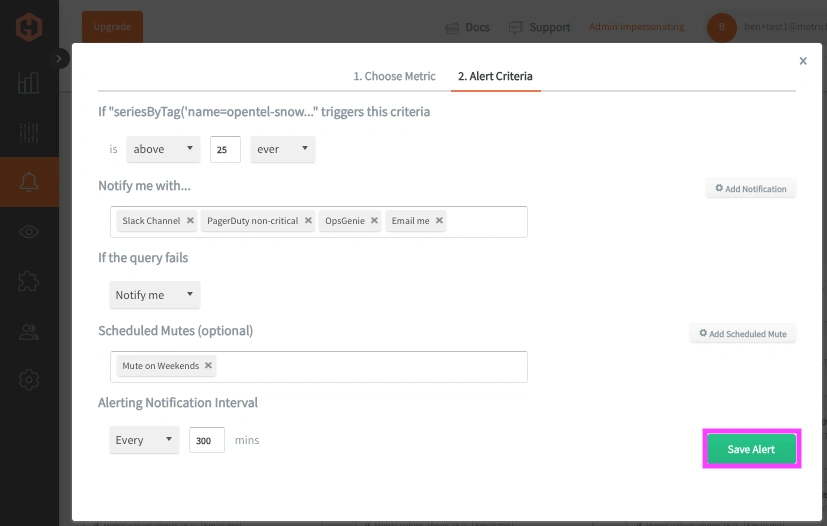
Then, select the Alert Criteria tab to set a threshold and select a notification channel. The default notification channel will be the email you used to sign up for the Hosted Graphite account. Still, you can easily configure channels for Slack, PagerDuty, Microsoft Teams, OpsGenie, custom webhooks and more. See the Hosted Graphite Notification Channels docs for more details:
Best Practices for Effective Monitoring
-
Granular Metrics: Collect metrics at a granular level to gain detailed insights into system behavior.
-
Regular Audits: Periodically review and update monitoring configurations to adapt to changes in workloads and system architecture.
-
Security Considerations: Ensure that telemetry data is handled securely, with appropriate access controls and encryption in place.
Conclusion
Setting up OpenTelemetry with Snowflake gives you enhanced visibility into how your data warehouse is performing. Instead of relying on the Snowflake UI for daily insights, OTel enables you to stream critical metrics (such as query execution times, queue delays, storage usage, and compute costs) directly into your preferred monitoring stack. This means you can track performance trends, identify slow queries early, and optimise warehouse usage without requiring manual intervention. Whether you're debugging query lag, scaling warehouses, or simply monitoring billing, OTel makes it easier, faster, and more automated.
Integrating OpenTelemetry with Snowflake empowers organizations to achieve comprehensive observability, facilitating proactive performance management and rapid issue resolution. By following the steps outlined in this guide and adhering to best practices, teams can unlock deeper insights into their Snowflake environments, driving efficiency and reliability in data operations.
Sign up for the free trial and begin monitoring your infrastructure today. You can also book a demo and talk to the MetricFire team directly about your monitoring needs.