Table of Contents
Great systems are not just built. They are monitored.
MetricFire hosts Graphite & Grafana as a managed service for small engineering teams, taking care of storage, scaling and version updates. Pricing starts at $19/month, billed per namespace metric instead of per host, with engineer-staffed support. Heroku, AWS, Azure, and GCP are natively integrated. We store your data with 3× redundancy in SOC2- and ISO:27001-certified data centres.
Introduction
When discussing observability, the “big 3” - logs, metrics, and traces, always get mentioned. But for some, more data doesn’t always mean better. Our lead engineer, JJ, had some advice to share about how logs may not be necessary for everyone. Simplifying your observability stack isn’t difficult - you just need to be intentional with implementation.
Check out more MetricFire blog posts below, and our hosted Graphite service! Get a free trial and start using MetricFire now! Feel free to book a demo if you have questions about what MetricFire can do for you.
Logging isn’t necessary when monitoring is set up properly
We believe that if your monitoring is set up correctly, logs are nice to have and nothing more. Centralized logging provides good insight, but as our lead engineer JJ states, “…Realistically, you only want to know the errors in your logs when there’s a problem.” Logs are a great tool for identifying issues, but you don’t need them. If you configure your monitoring with more intention to what metrics you send, you can get just as much detailed information as logs with quicker insights at a glance.
“Reading through your logs to find what happened is going to be ten times slower than looking at the chart that basically tells you.” - JJ
For most, metric charts are better than log lines because you typically don’t want to parse a bunch of logs yourself to understand what’s happening in the server/service. If you wanted to know the state, you could have just sent that information as metrics in the first place. Plus, many developers use tools like Sentry that log, track, and report errors in a more controlled way while giving additional insights. This makes aggregating all logs and storing them almost useless, as you would likely only be hunting for the errors in the first place. So why are you hoarding all those logs?
“Metric charts are always going to be easier to understand than hundreds of log lines.” - Jonathan Goodman
If you start with a select smaller set of data you can add in more metrics to provide greater detail in the future. Starting small can give your team the time to set up everything in a way that best suits your unique monitoring needs, rather than sending every bit of data your application creates and sorting through it all after for what is important to your team. Too much data will start to distract from what’s really happening in your system.
Problem with Logs before Metrics
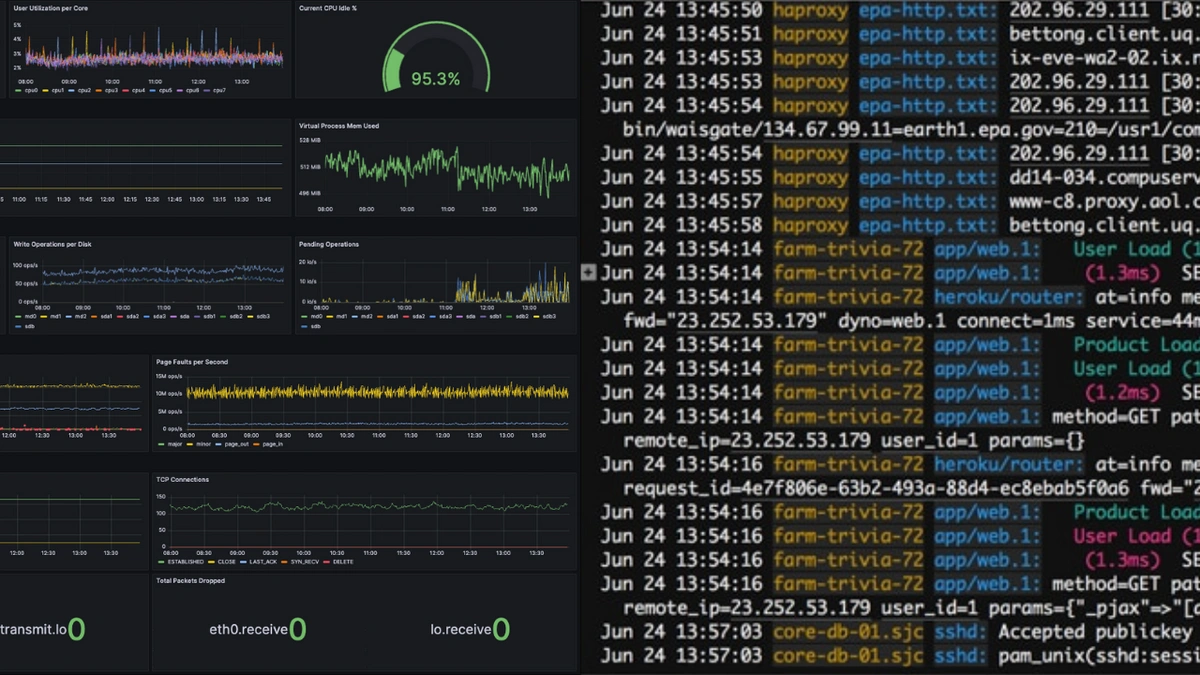
So many teams start off their monitoring by logging everything they can and patting themselves on the back, thinking that, they’ve got all the information, so of course, they’ll be able to identify their issues. However, these logs often just get aggregated together into a text soup of data that takes either a query wizard to make sense of it or some kind of expensive AI solution that will summarize what’s happening - often missing important details that could be unique to your system.
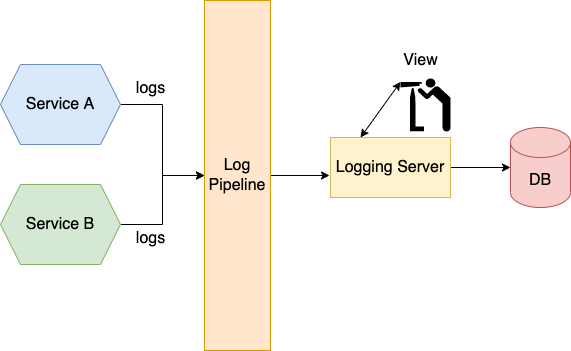
Log aggregation systems often promise to “just send it all” and worry about it later. They promise to do the heavy lifting and generate insights for you. All you’ll need is a credit card with no limits. These systems often price by the amount of data they store, therefore all the extra data you’re sending is costing you heavily vs the data you’re using or probably even need.
That’s why we believe metrics (as actual metrics) are a much better way to start monitoring your system. Metrics are easier to visualize and build up slowly without the amount of data becoming overwhelming. You can then start sending unique application-specific metrics from inside your codebase more intentionally, keeping your monitoring organized.
Example of Lackluster Logging (Heroku)
A perfect example of this in action is with Heroku applications. By default, Heroku provides logs from aspects of your app like the dyno, runtime, add-ons, etc. This seems great at first, but users quickly realize that reading each log to get insight into how their application is running is fairly inefficient.

That’s why we provide an addon for Heroku apps that makes these logs more useful. Our Hosted Graphite integration with Heroku apps parses through Heroku logs and turns them into metrics, we then provide premade dashboards that help users get better visibility into how their apps are performing.

But wait? Didn’t we just complain about this exact thing? Hey! Thank you for paying attention! Yes, exactly, making metrics from logs is fairly inefficient, that’s why it’s also possible to start sending metrics directly to us as well! This allows teams to start getting the insights they truly want from their applications. We don’t actually store the logs, only the metrics, so there’s no extra cost involved with sending the log data you don’t need.
Even better, once you understand how your application is running, you can quickly set up alerts to monitor what’s most important for your team.
If you use Hosted Graphite, you get basic Heroku application metrics and Kafka, Postgres, and Redis metrics, starting at $19/month, with a dedicated support team for your monitoring.
Obligatory Defence
Okay, we’ve been fairly critical of logs so far. So what do we like about them?
Logs are still very helpful, especially in cases where applications unexpectedly crash due to some unforeseen failure in either the application or potentially even the hardware. Logs are meant to provide detailed insights into some event that has happened, and they can do exactly that. Many DEVs and SREs use logs to identify the root causes of issues with their system/application. And for that reason, they can be indispensable to some.
The important point to remember is that no matter what types of monitoring you implement for your systems, be intentional about the data you want to collect.
Get Started with MetricFire
If you want a team of experts to help you with your monitoring questions 24/7, contact us today. We’d love to chat with you about your current stack and see what we can do to help.
Conclusion
Logging is a great tool, but you are not required to have logs to gain clear observability in your system.
Visualizing metrics in a clear dashboard is often faster than sifting through logs when identifying issues. If you focus on defining your metrics properly, you can save time and money by ditching the library of babel you’re creating with all those logs.
Check out more MetricFire blog posts below, and our hosted Graphite service! Get a free trial and start using MetricFire now! Feel free to book a demo if you have questions about what MetricFire can do for you.