
Table of Contents
Great systems are not just built. They are monitored.
MetricFire runs Graphite and Grafana as a fully managed service for growing engineering teams, taking care of storage, scaling, and version updates so your team doesn't have to. Plans start at $19/month, billed per metric namespace rather than per host, and include engineer-staffed support. Integrations work natively with Heroku, AWS, Azure, and GCP, and data is stored with 3× redundancy in SOC2- and ISO:27001-certified data centres.
Introduction
OracleDB remains a top choice as a relational database management system (RDBMS), despite its strict licensing requirements. It excels at handling complex SQL queries, massive datasets, and transactional workloads, making it ideal for large Enterprise technology stacks. Its many benefits include robust indexing, partitioning, and in-memory processing to optimize query performance at scale. While OracleDB can be challenging to deploy and manage, its ability to efficiently process and analyze data offsets the complexity, making it a valuable asset for large, well funded tech businesses.
In this article, we'll explain how to configure an OracleDB VM and use the OpenTelemetry Collector to scrape/export instance metrics to a Carbon endpoint.
Setting Up OracleDB Express Edition (XE)
Oracle Cloud is the easiest way to test OracleDB XE because it provides pre-configured VM images, saving you from manually setting up dependencies and system configs. That said, even Oracle's own cloud images come with their quirks - tight sudo restrictions, complex licensing, and a maze of setup steps. So while Oracle Cloud is still somewhat complicated, it’s easier than trying to install OracleDB from scratch on another OS.
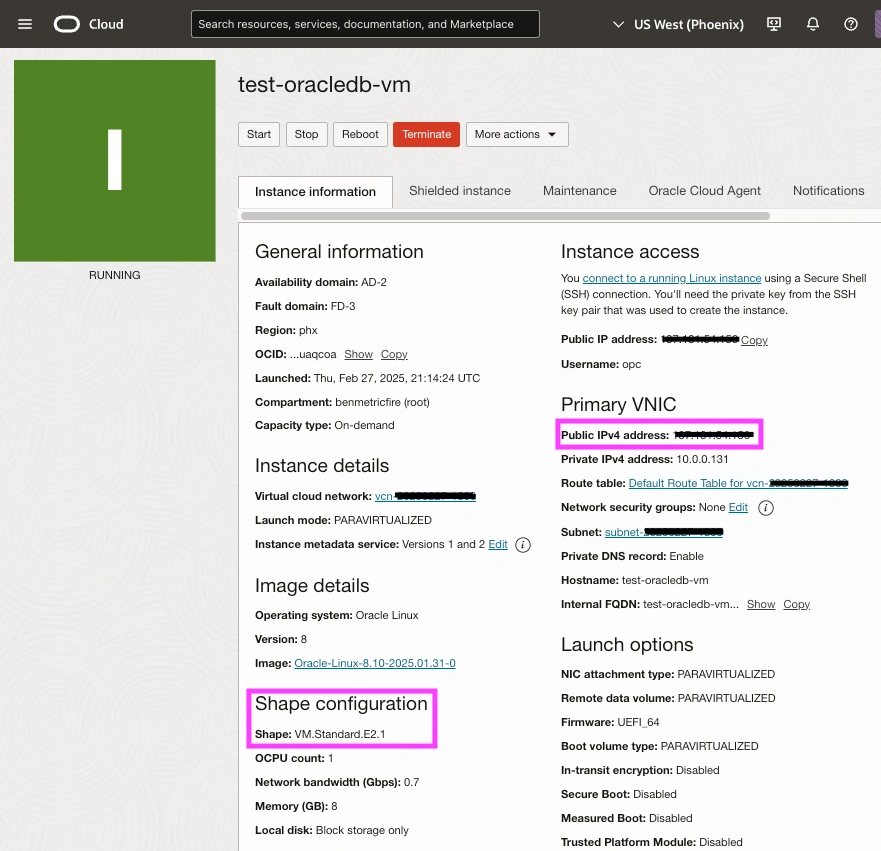
If you don't already have an Oracle Cloud instance, create a free trial account, and launch a new VM through the Oracle Cloud UI.
NOTE:
- Configuring 2FA is required when creating a free Oracle Cloud account
- The default micro instance (1GB RAM) is too small for what we need, so use the VM.Standard.E2.1 (8GB RAM) shape instead
- When launching a new instance, make sure to download your Private SSH key when prompted
Connect to VM
Download your private key when prompted in the Oracle UI, move it to your SSH directory, assign permissions, and connect to your running VM instance:
mv ~/Desktop/<PRIVATE-KEY>.key ~/.ssh/
chmod 600 ~/.ssh/<PRIVATE-KEY>.key

ssh -i ~/.ssh/<PRIVATE-KEY>.key opc@<INSTANCE-PUBLIC-IP>
Install OracleDB XE
Oracle often requires users to accept licensing agreements before downloading software, which can cause direct wget downloads to fail (unless specific headers are included). So its easier to manually download the RPM from Oracle's official site. Once downloaded (to your local Desktop), just upload it to your VM instance:
scp -i ~/.ssh/<PRIVATE-KEY>.key \
    ~/Desktop/oracle-database-xe-21c-1.0-1.ol8.x86_64.rpm \
    opc@<INSTANCE-PUBLIC-IP>:~
Verify and install the RPM package:
ls -lh oracle-database-xe-21c-1.0-1.ol8.x86_64.rpm

sudo dnf install -y oracle-database-xe-21c-1.0-1.ol8.x86_64.rpm
sudo /etc/init.d/oracle-xe-21c configure
The above 'configure' command will prompt you to add a PW, the following examples use: MyPassword
Enter Your Container From the SQL Shell
For convenience, you can add variables to your shell profile, to enter the SQL command line from anywhere in your instance:
echo 'export ORACLE_HOME=/opt/oracle/product/21c/dbhomeXE' >> ~/.bashrc
echo 'export PATH=$ORACLE_HOME/bin:$PATH' >> ~/.bashrc
echo 'export ORACLE_SID=XE' >> ~/.bashrc
source ~/.bashrc
Open a sqlplus shell (must include your PW to enter as system admin):
sqlplus sys/MyPassword as sysdba
Confirm your connection status and locate your CONTAINER-NAME:
SELECT status FROM v$instance;
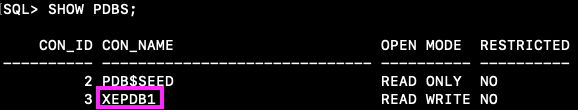
SHOW CON_NAME;
SHOW PDBS;
Connect to your container:
ALTER SESSION SET CONTAINER=<CONTAINER-NAME>;
Configure a Test User and Insert Sample Data
Create test_user and grant permissions (must include your PW):
CREATE USER test_user IDENTIFIED BY MyPassword;
GRANT CONNECT, RESOURCE TO test_user;
ALTER USER test_user QUOTA UNLIMITED ON USERS;
Connect as test_user (must include your CONTAINER-ID):
CONNECT test_user/MyPassword@localhost:1521/<CONTAINER-NAME>;
Create a sample table:
CREATE TABLE customers (
    id NUMBER GENERATED ALWAYS AS IDENTITY PRIMARY KEY,
    name VARCHAR2(100),
    email VARCHAR2(100) UNIQUE,
    created_at TIMESTAMP DEFAULT CURRENT_TIMESTAMP
);
Insert sample data:
INSERT INTO customers (name, email) VALUES ('Alice Johnson', 'alice@example.com');
INSERT INTO customers (name, email) VALUES ('Bob Smith', 'bob@example.com');
INSERT INTO customers (name, email) VALUES ('Charlie Davis', 'charlie@example.com');
COMMIT;
Verify the data:
SELECT * FROM customers;
In preparation for installing OpenTelemetry in the next step, grant permissions to connect it with test_user:
GRANT SELECT ON V_$SYSSTAT TO test_user;
GRANT SELECT ON V_$SESSION TO test_user;
GRANT SELECT ON V_$RESOURCE_LIMIT TO test_user;
GRANT SELECT ON DBA_TABLESPACE_USAGE_METRICS TO test_user;
GRANT SELECT ON DBA_TABLESPACES TO test_user;
GRANT SELECT ANY DICTIONARY TO test_user;
GRANT SELECT_CATALOG_ROLE TO test_user;
Install and Configure OpenTelemetry
OpenTelemetry as a Collector has built-in support for NGINX, PostgreSQL, Redis, RabbitMQ, Kubernetes, Elasticsearch, and many more! These Receivers pull key performance metrics directly from your services—no manual parsing or custom scripts needed. If you don't already use OpenTelemetry, below are examples of how to install and configure otelcol-contrib to collect system metrics and export them to a Carbon endpoint.
Install the OpenTelemetry Collector
A common workaround is to install software in a user-writable directory (e.g: /tmp or /home/opc/otel-install/), allowing OpenTelemetry Contrib to run without requiring sudo access:
cd /tmp

wget -O otelcol.rpm https://github.com/open-telemetry/opentelemetry-collector-releases/releases/download/v0.119.0/otelcol-contrib_0.119.0_linux_amd64.rpm

mkdir -p ~/otel-install
cd ~/otel-install

rpm2cpio /tmp/otelcol.rpm | cpio -idmv --no-absolute-filenames
Confirm the Installation
Make sure that OTel was correctly downloaded at: /tmp and extracted to: /home/opc/otel-install/:
/home/opc/otel-install/usr/bin/otelcol-contrib --version
Configure the OracleDB Receiver and Carbon Exporter
The OracleDB Receiver in OpenTelemetry collects metrics from localhost:1521, processes them, and forwards them to your exporter of choice.
The Carbon Exporter takes those metrics and ships them straight to Graphite-compatible backends, making it easy to integrate OpenTelemetry with minimal setup.
If you're not currently hosting your own Graphite data source, start a 14-day free trial with Hosted Graphite by MetricFire to continue following along with this example. A MetricFire account will provide the Graphite data source and include Hosted Grafana as a visualization tool - along with Alerting, Integrations, and Team features.
- First, create a new file named config.yaml at: /home/opc/otel-install/config.yaml
- Add the below configuration
- Be sure to include your <CONTAINER-NAME> <HG-API-KEY> and <HOSTNAME>
receivers:
  oracledb:
    endpoint: "localhost:1521"
    service: "<CONTAINER-NAME>"
    username: "test_user"
    password: "MyPassword"

processors:
  batch: {}
  metricstransform:
    transforms:
      - include: ".*"
        match_type: regexp
        action: update
        new_name: "<HG-API-KEY>.opentel.$$0"
        operations:
          - action: add_label
            new_label: host
            new_value: <HOSTNAME>

exporters:
  carbon:
    endpoint: "carbon.hostedgraphite.com:2003"
    timeout: 10s

service:
  pipelines:
    metrics:
      receivers:
        - aerospike
      processors:
        - batch
        - metricstransform
      exporters:
        - carbon
Now save your changes and serve the file manually - to start the service and troubleshoot potential configuration errors:
~/otel-install/usr/bin/otelcol-contrib --config ~/otel-install/config.yaml
Ship Tagged Graphite Metrics
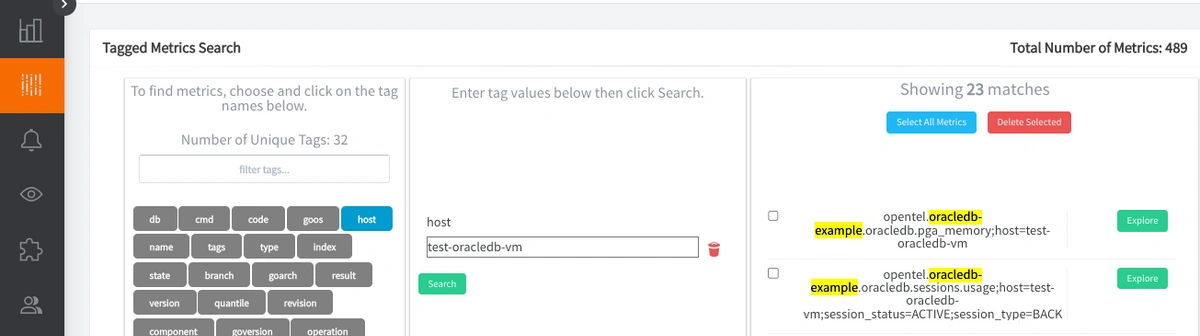
Within two minutes of restarting the otelcol-contrib service, a set of Tagged Graphite metrics will be forwarded to your Hosted Graphite account (with the opentel.oracledb prefix).
Why does OpenTelemetry export Tagged metrics to Carbon?
- Because it's core model aligns more with Prometheus-style 'labels' than Graphite's 'dot notation' formatting. Instead of flattening data into long metric names, it preserves the labels by using Graphite tags, which enables richer filtering in your Graphite backend.
Now you can locate these Tagged Metrics in the Hosted Graphite Tag Search UI - under the host tag:
Otherwise, you can configure a different exporter to forward metrics to another data source.
You can also run more sqlplus commands (select/insert/delete) to see how they affect your metric values.
Use Hosted Graphite by MetricFire to Create Custom Dashboards and Alerts
MetricFire is a monitoring platform that enables you to gather, visualize and analyze metrics and data from servers, databases, networks, processes, devices, and applications. Using MetricFire, you can effortlessly identify problems and optimize resources within your infrastructure. Hosted Graphite by MetricFire removes the burden of self-hosting your monitoring solution, allowing you more time and freedom to work on your most important tasks.
Metrics sent to the public carbon endpoint will be timestamped, and aggregated into the Hosted Graphite backend.
-
OpenTelemetry metrics will be sent and stored in the Graphite Tag format of: my.series;tag1=value1;tag2=value2 metric_value (timestamp)
-
The tags provide a filtering option, making the metrics efficient to query
-
Metrics are stored in your Hosted Graphite account for two years, and you can use them to create custom Dashboards and Alerts.
Build Custom Dashboards in MetricFire's Hosted Grafana
In the Hosted Graphite UI, navigate to Dashboards and select + New Dashboard to create a new visualization.
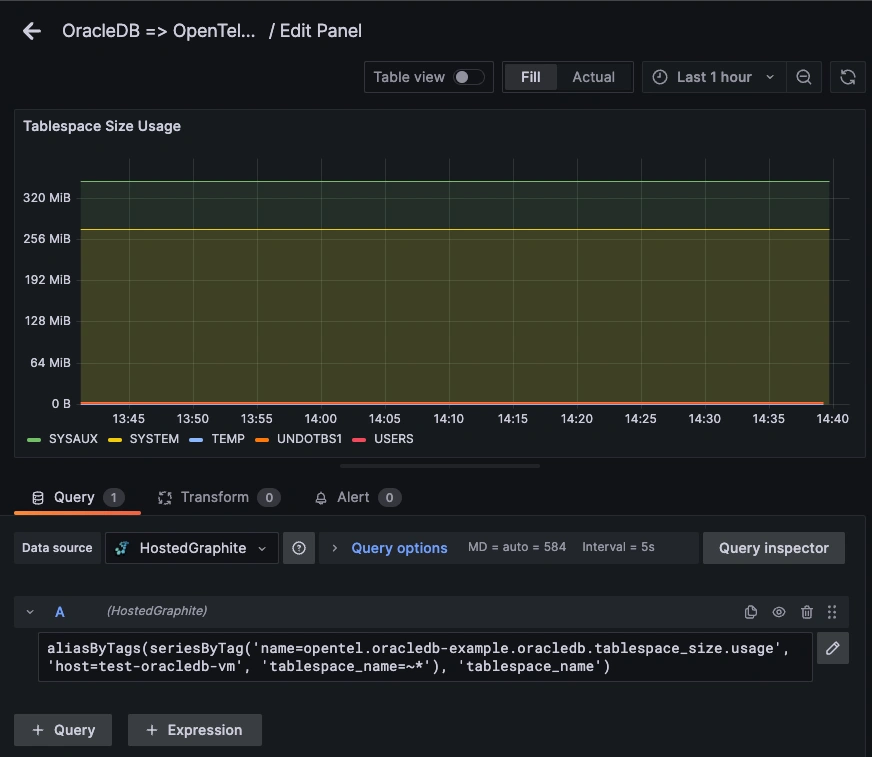
Then go into Edit mode and use the Query UI to select a graphite metric path (the default data source will be HostedGraphite if you are accessing Grafana via your HG account).
NOTE: To query Tagged Graphite metrics, you must apply the seriesByTag Graphite function, and the aliasByTags function will make your metric names more readable on the graph.
Grafana has many additional options to apply different visualizations, modify the display, set units of measurement, and some more advanced features like configuring dashboard variables and event annotations.
See the Hosted Graphite Dashboard docs for more details around building custom Grafana visualizations.
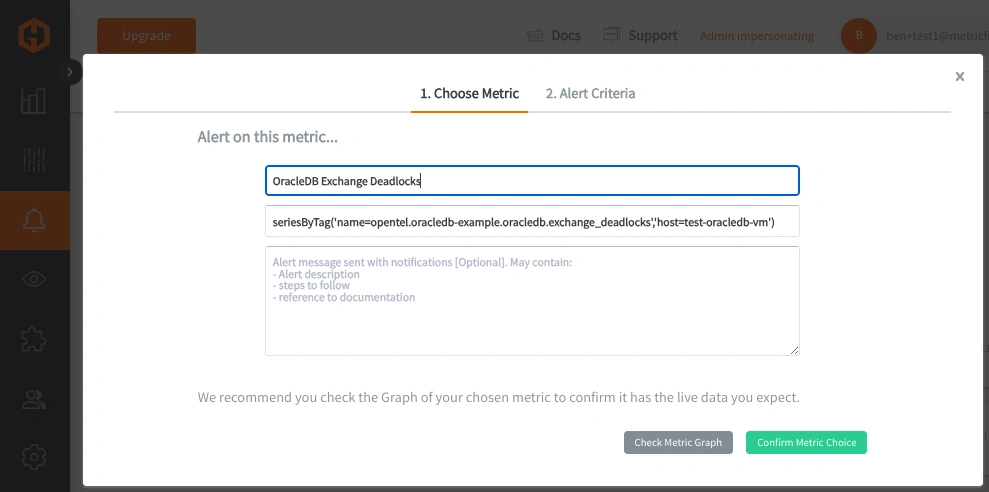
Creating Graphite Alerts
In the Hosted Graphite UI, navigate to Alerts => Graphite Alerts to create a new alert. Name the alert, add your Tagged OracleDB Metric to the alerting metric field, and add a description of what this alert is:
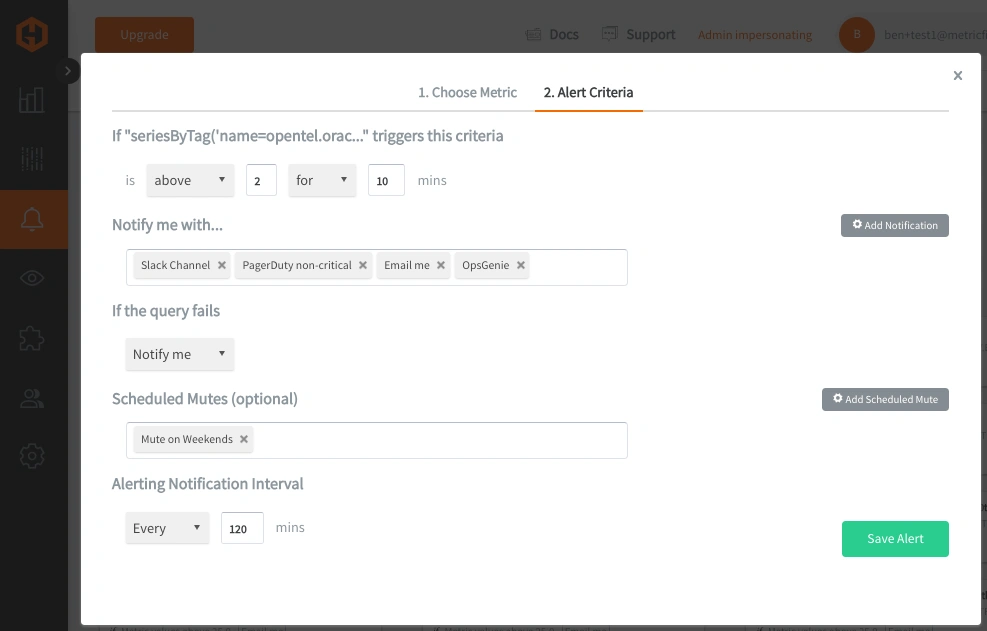
Then, select the Alert Criteria tab to set a threshold and select a notification channel. The default notification channel will be the email you used to sign up for the Hosted Graphite account. Still, you can easily configure channels for Slack, PagerDuty, Microsoft Teams, OpsGenie, custom webhooks and more. See the Hosted Graphite Notification Channels docs for more details:
Conclusion
Tech businesses choose OracleDB for its powerful querying, reliability, and ability to handle massive datasets at scale. But managing it isn’t always easy, so using OpenTelemetry for monitoring helps spot performance issues, optimize queries, and keep critical systems running smoothly for your business.
Sign up for the free trial and begin monitoring your infrastructure today. You can also book a demo and talk to the MetricFire team directly about your monitoring needs.

