


Table of Contents
Great systems are not just built. They are monitored.
MetricFire runs Graphite and Grafana as a fully managed service for growing engineering teams, taking care of storage, scaling, and version updates so your team doesn't have to. Plans start at $19/month, billed per metric namespace rather than per host, and include engineer-staffed support. Integrations work natively with Heroku, AWS, Azure, and GCP, and data is stored with 3× redundancy in SOC2- and ISO:27001-certified data centres.
Introduction
Monitoring socket connections in your servers is critical because it ensures network communication is functioning correctly and identifies potential issues such as bottlenecks or unauthorized access. It helps maintain server performance and security by detecting abnormal or malicious activities early. Additionally, monitoring provides valuable insights for troubleshooting and optimizing application and network configurations.
In this article, we'll detail how to use the Telegraf agent to collect socket connections statistics and forward them to a data source.
Getting Started with the Telegraf Agent
Telegraf is a plugin-driven server agent built on InfluxDB that collects and sends metrics/events from databases, systems, processes, devices, and applications. It is written in Go, compiles into a single binary with no external dependencies, and requires a minimal memory footprint. Telegraf is compatible with many operating systems and has many helpful output plugins and input plugins for collecting and forwarding a wide variety of system performance metrics.
Install Telegraf (Linux/Redhat)
/etc/telegraf/wget https://dl.influxdata.com/telegraf/releases/telegraf_1.30.0-1_amd64.deb
sudo dpkg -i telegraf_1.30.0-1_amd64.deb
RedHat/CentOS
wget https://dl.influxdata.com/telegraf/releases/telegraf-1.30.0-1.x86_64.rpm
sudo yum localinstall telegraf-1.30.0-1.x86_64.rpm
Configure an Output
You can configure Telegraf to output to various sources, such as Kafka, Graphite, InfluxDB, Prometheus, SQL, NoSQL, and more.
In this example, we will configure telegraf with a Graphite output. If you're not currently hosting your data source, start a 14-day free trial with Hosted Graphite by MetricFire to follow these next steps.
A Hosted Graphite account will provide the data source, offer an alerting feature, and include Hosted Grafana as a visualization tool.
To configure the Graphite output, locate the downloaded telegraf configuration file at /etc/telegraf/telegraf.conf and open it in your preferred text editor. Then, you will need to make the following changes to the file:
First, uncomment the line:
[[outputs.graphite]]
Next, uncomment and edit the server line to:
servers = ["carbon.hostedgraphite.com:2003"]
Finally, uncomment and edit the prefix line to:
prefix = "<YOUR_API_KEY>.telegraf"
Create a Simple TCP Sever and Client With the Netcat Utility
This article assumes that you already have active socket connections within your server. If you you want to create a simple server/client for testing purposes, below are steps on how to achieve this using Netcat. This example is using a Docker container running an image of Ubuntu 20.04:
- prerequisites:
- sudo apt-get install -y iproute2 netcat
- create a simple TCP server:
- nc -l -p 12345
- This command starts a Netcat server that listens on port 12345 for incoming connections
- create a simple TCP client:
- open another Docker terminal window: docker exec -it <container_id> /bin/bash
- nc localhost 12345
- The client initiates a connection to the server's fixed port (12345)
- The client's source port is dynamically assigned by the operating system from the range of ephemeral ports (e.g., 54914 in this case)
Configure the Telegraf Plugin
Telegraf has many input plugins that can collect a wide range of data from many popular technologies and 3rd party sources. In this example, we'll demonstrate how to collect and forward metrics from your webhook endpoints.
You will need to search for the inputs.socketstat section in your telegraf.conf file, uncomment the [[inputs.socketstat]] line:
[[inputs.socketstat]]
Additionally, you can uncomment the 'protocols' line to define which protocols to collect metrics from. If left commented out, it will default to TCP:
protocols = [ "tcp", "udp" ]
Then you can run the telegraf daemon using the following command, which will help you see if there are any configuration errors in the output:
telegraf --config telegraf.conf
Telegraf will now forward socketstat metrics to your configured datasource. This is what the metrics from the above Docker configuration should look like in the Graphite format:
telegraf.d165745c8618.127_0_0_1.12345.tcp.127_0_0_1.54914.socketstat.recv_q
telegraf.d165745c8618.127_0_0_1.12345.tcp.127_0_0_1.54914.socketstat.segs_in
telegraf.d165745c8618.127_0_0_1.12345.tcp.127_0_0_1.54914.socketstat.send_q
telegraf.d165745c8618.127_0_0_1.54914.tcp.127_0_0_1.12345.socketstat.bytes_acked
telegraf.d165745c8618.127_0_0_1.54914.tcp.127_0_0_1.12345.socketstat.recv_q
telegraf.d165745c8618.127_0_0_1.54914.tcp.127_0_0_1.12345.socketstat.segs_in
telegraf.d165745c8618.127_0_0_1.54914.tcp.127_0_0_1.12345.socketstat.segs_out
telegraf.d165745c8618.127_0_0_1.54914.tcp.127_0_0_1.12345.socketstat.send_q
telegraf.d165745c8618.172_17_0_2.45034.tcp.144_76_143_215.2003.socketstat.bytes_acked
telegraf.d165745c8618.172_17_0_2.45034.tcp.144_76_143_215.2003.socketstat.data_segs_out
telegraf.d165745c8618.172_17_0_2.45034.tcp.144_76_143_215.2003.socketstat.recv_q
telegraf.d165745c8618.172_17_0_2.45034.tcp.144_76_143_215.2003.socketstat.segs_in
telegraf.d165745c8618.172_17_0_2.45034.tcp.144_76_143_215.2003.socketstat.segs_out
telegraf.d165745c8618.172_17_0_2.45034.tcp.144_76_143_215.2003.socketstat.send_q
Metric Format: telegraf.<host>.<source-ip>.<source-port>.<protocol>.<destination-ip>.<destination-port>.socketstat.<metric>
Metric Breakdown for this Docker example:
- 127_0_0_1.12345. => .127_0_0_1.54914: This mapping indicates that the Netcat server on localhost fixed port 12345 is communicating with the NC client on assigned localhost port 54914
- 127_0_0_1.54914. => .127_0_0_1.12345: This mapping indicates that the Netcat client on assigned localhost port 54914 is communicating with the NC server on fixed localhost port 12345
- 172_17_0_2.45034. => .144_76_143_215.2003: This mapping indicates that the Docker container with IP 172.17.0.2 and source port 45034, is sending data to the external Graphite server at IP 144.76.143.215 on port 2003
NOTE: Your production environment might have hundreds or thousands of socket connections tied to running processes.
You can use a tool like lsof to see which ports are tied to which processes running in your server: sudo lsof -i :<port>
See the official GitHub repository for additional details and configuration options for the socketstat plugin.
Use Hosted Graphite by MetricFire to Create Custom Dashboards and Alerts
MetricFire is a monitoring platform that enables you to gather, visualize and analyze metrics and data from servers, databases, networks, processes, devices, and applications. Using MetricFire, you can effortlessly identify problems and optimize resources within your infrastructure. Hosted Graphite by MetricFire removes the burden of self-hosting your monitoring solution, allowing you more time and freedom to work on your most important tasks.
Once you have signed up for a Hosted Graphite account and used the above steps to configure your server(s) with the Telegraf Agent, metrics will be forwarded, timestamped, and aggregated into the Hosted Graphite backend. For teams managing complex data pipelines or needing to route socket metrics to multiple destinations, Integrate.io provides a low-code ETL platform that can help transform and distribute your metrics alongside other business data.
-
Metrics will be sent and stored in the Graphite format of: metric.name.path <numeric-value> <unix-timestamp>
-
The dot notation format provides a tree-like data structure, making it efficient to query
-
Metrics are stored in your Hosted Graphite account for two years, and you can use them to create custom Alerts and Grafana dashboards.
Build Dashboards in Hosted Graphite's Hosted Grafana
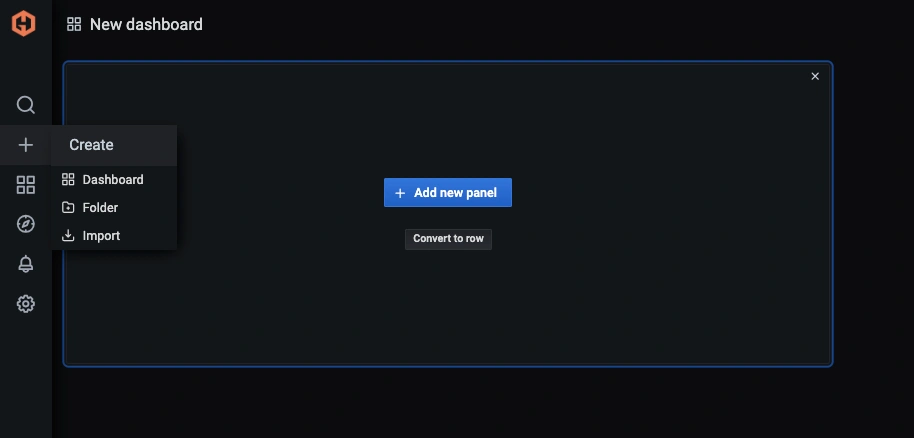
In the Hosted Graphite UI, navigate to Dashboards => Primary Dashboards and select the + button to create a new panel:
Then you can use the query UI in Edit mode to select a graphite metric path (the default data source will be the hosted graphite backend if you are accessing Grafana via your HG account):
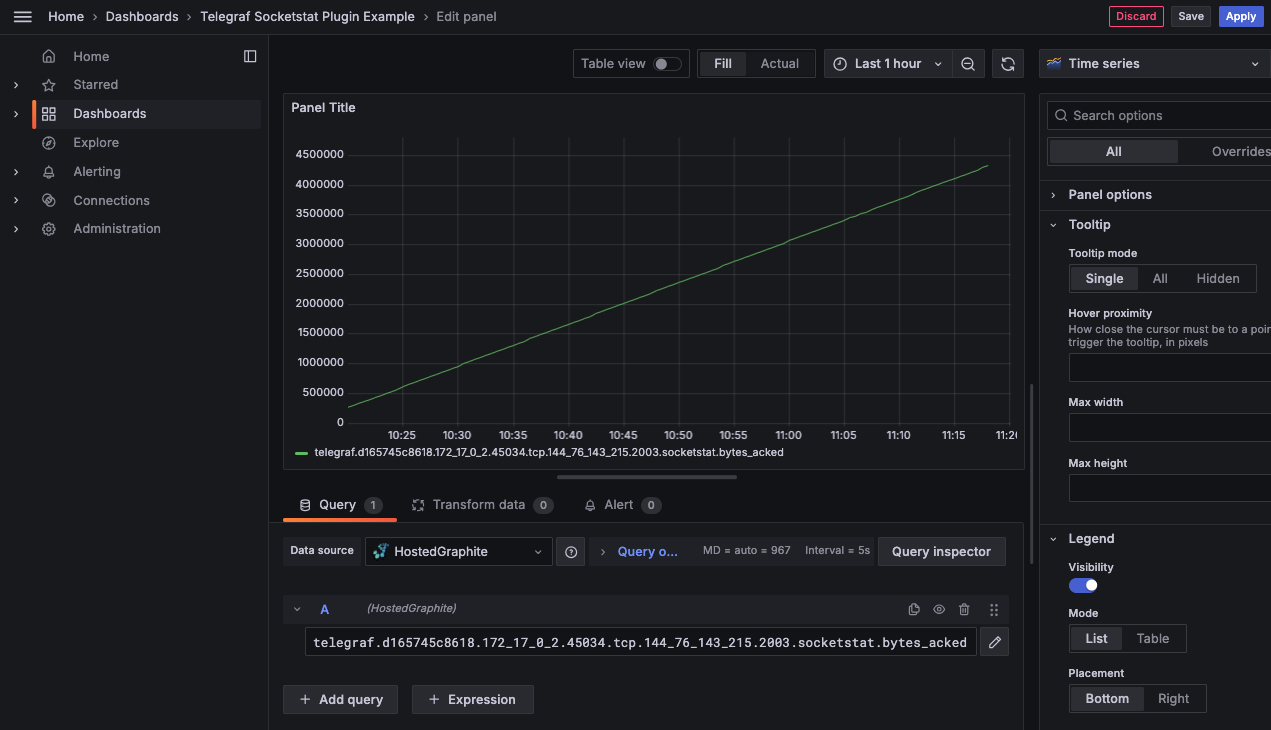
NOTE: The Hosted Graphite datasource also supports wildcard (*) searching to grab all metrics that match a specified path.
Now you can apply Graphite functions to these metrics like aliasByNode() to format the name, and exclude() to omit a specified pattern:
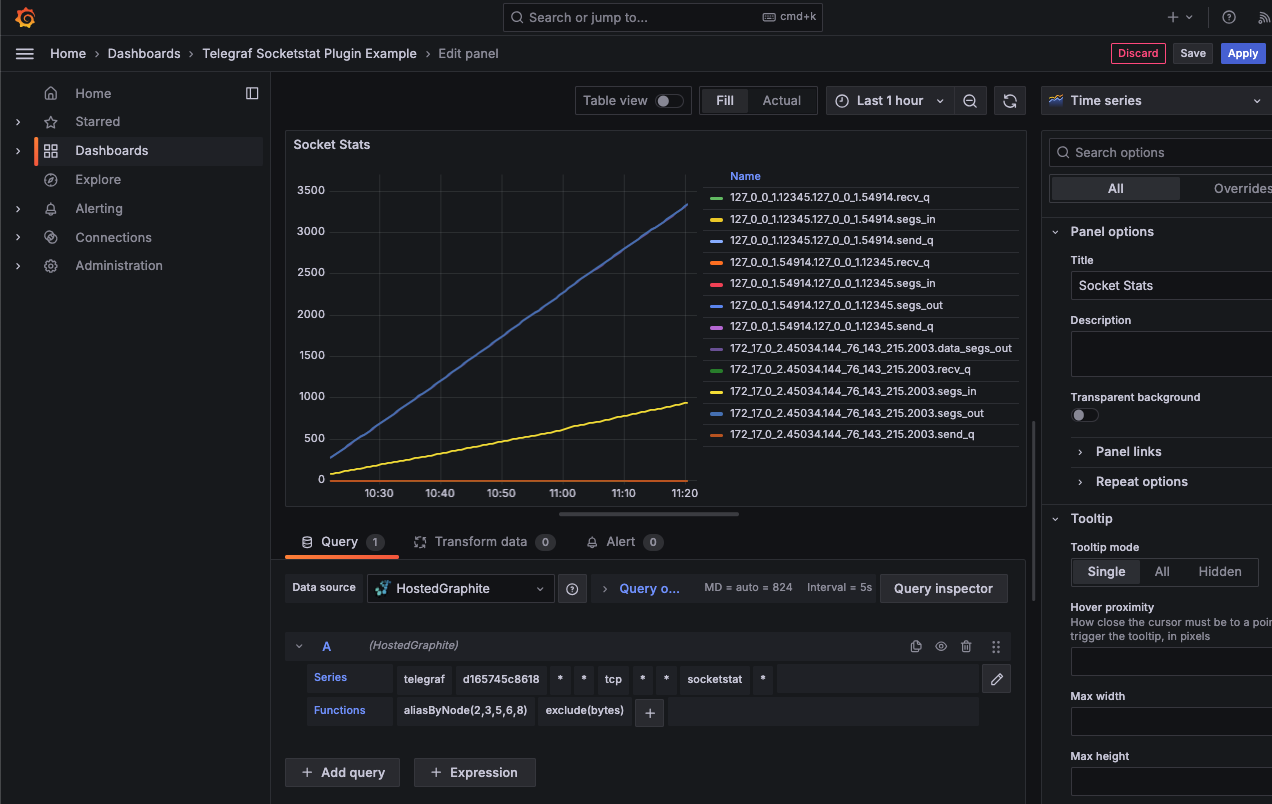
Grafana has many additional options to apply different visualizations, modify the display, set units of measurement, and some more advanced features like configuring dashboard variables and event annotations.
See the Hosted Graphite dashboard docs for more details.
Creating Graphite Alerts
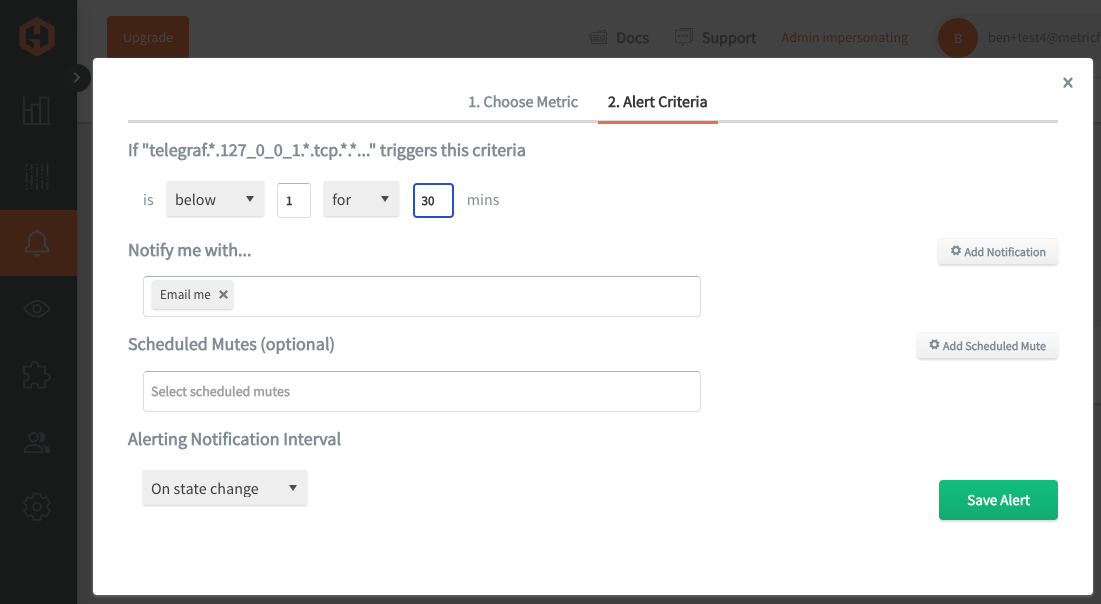
In the Hosted Graphite UI, navigate to Alerts => Graphite Alerts to create a new alert. Name the alert, add a query to the alerting metric field, and add a description of what this alert is:
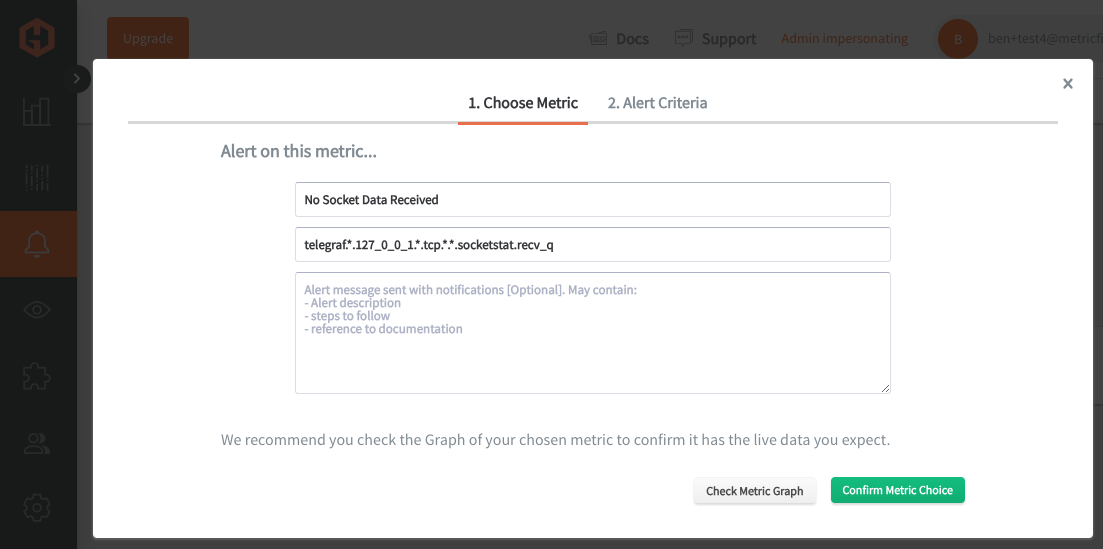
Then, select the Alert Criteria tab to set a threshold and select a notification channel. The default notification channel will be the email you used to sign up for the Hosted Graphite account. Still, you can easily configure channels for Slack, PagerDuty, Microsoft Teams, OpsGenie, custom webhooks and more. See the Hosted Graphite docs for more details on notification channels:
Conclusion
Monitoring socket connections within your servers is imperative for your business to ensure reliable and secure network communication, which is essential for uninterrupted service delivery and customer satisfaction. It also enables early detection of potential security breaches and performance issues, safeguarding sensitive data and maintaining optimal operational efficiency.
Tools like dashboards and alerts will complement your data by providing real-time visualization, proactive identification of issues, historical trend analysis, and facilitating informed decision-making, all essential for maintaining a robust and efficient infrastructure.
Sign up for the free trial and begin monitoring your infrastructure today. You can also book a demo and talk to the MetricFire team directly about your monitoring needs.


