Table of Contents
Introduction
ZFS (Zettabyte File System) is a file system and volume manager that has robust data integrity features and uses checksums for every block of data, ensuring that any data corruption is detected and corrected. Additionally, it offers advanced features such as pooled storage, efficient snapshots and cloning, built-in data compression, deduplication, and high scalability, making it ideal for large-scale and high-performance storage environments. ZFS also simplifies storage management by allowing multiple physical storage devices to be combined into a single pool. ZFS is often used in server environments to handle enterprise-level storage needs, providing robust performance and reliability for critical applications.
Monitoring ZFS across your server infrastructure is crucial for ensuring data integrity and system performance. It helps in detecting potential issues like data corruption, disk failures, and resource bottlenecks, allowing for proactive maintenance and optimal operation of your storage systems.
In this article, we'll detail how to use the Telegraf agent to collect ZFS service statistics, and forward them to a data source.
Getting Started with the Telegraf Agent
Telegraf is a plugin-driven server agent built on InfluxDB that collects and sends metrics/events from databases, systems, processes, devices, and applications. It is written in Go, compiles into a single binary with no external dependencies, and requires a minimal memory footprint. Telegraf is compatible with many operating systems and has many helpful output plugins and input plugins for collecting and forwarding a wide variety of system performance metrics.
Install Telegraf (Linux/Redhat)
/etc/telegraf/wget https://dl.influxdata.com/telegraf/releases/telegraf_1.30.0-1_amd64.deb
sudo dpkg -i telegraf_1.30.0-1_amd64.deb
RedHat/CentOS
wget https://dl.influxdata.com/telegraf/releases/telegraf-1.30.0-1.x86_64.rpm
sudo yum localinstall telegraf-1.30.0-1.x86_64.rpm
Configure an Output
You can configure Telegraf to output to various sources, such as Kafka, Graphite, InfluxDB, Prometheus, SQL, NoSQL, and more.
In this example, we will configure telegraf with a Graphite output. If you're not currently hosting your data source, start a 14-day free trial with Hosted Graphite by MetricFire to follow these next steps.
A Hosted Graphite account will provide the data source, offer an alerting feature, and include Hosted Grafana as a visualization tool.
To configure the Graphite output, locate the downloaded telegraf configuration file at /etc/telegraf/telegraf.conf and open it in your preferred text editor. Then, you will need to make the following changes to the file:
First, uncomment the line:
[[outputs.graphite]]
Next, uncomment and edit the server line to:
servers = ["carbon.hostedgraphite.com:2003"]
Finally, uncomment and edit the prefix line to:
prefix = "<YOUR_API_KEY>.telegraf"
Configure ZFS (Linux)
This article assumes that you already have an active zpool mounted and running in your Linux server(s), but below are some simple steps to configure ZFS for testing purposes:
- install: sudo apt install zfsutils-linux
- load the ZFS kernel module: sudo modprobe zfs
- create a file to use as a virtual disk: sudo fallocate -l 1G /zfsfile
- create a pool using this file: sudo zpool create mypool /zfsfile
- check status: sudo zpool status
- expected output:
  pool: mypool
 state: ONLINE
  scan: none requested
config:

    NAME        STATE     READ WRITE CKSUM
    mypool      ONLINE       0     0     0
      /zfsfile  ONLINE       0     0     0

errors: No known data errors
Configure the Telegraf Plugin
Telegraf has many input plugins that can collect a wide range of data from many popular technologies and 3rd party sources. In this example, we'll demonstrate how to collect and forward metrics from a ZFS volume manager.
You will need to search for the inputs.zfs section in your telegraf.conf file, uncomment that line:
[[inputs.zfs]]
Then you can run the telegraf daemon using the following command, which will help you see if there are any configuration errors in the output:
telegraf --config telegraf.conf
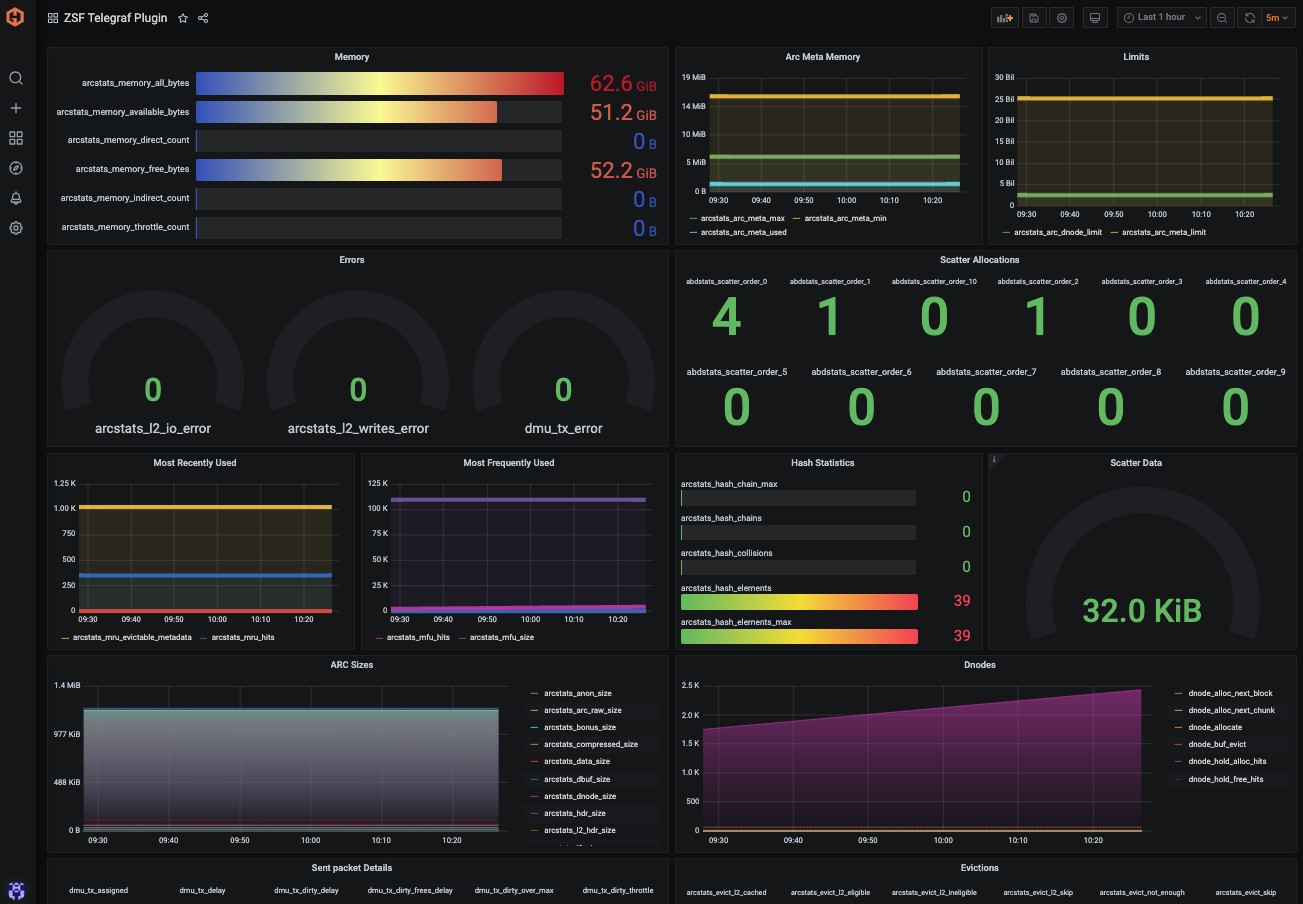
Telegraf will now forward zfs roughly 200 metrics to your configured datasource and report on memory usage, data allocation, and performance. They also report on aspects like scatter and linear data allocations, ARC (Adaptive Replacement Cache) statistics, metadata usage, eviction counts, dnode activity, vdev mirror performance, and ZIL (ZFS Intent Log) operations.
See the official GitHub repository for a list of metrics returned and additional configuration options for the zfs input plugin.
Use Hosted Graphite by MetricFire to Create Custom Dashboards and Alerts
MetricFire is a monitoring platform that enables you to gather, visualize and analyze metrics and data from servers, databases, networks, processes, devices, and applications. Using MetricFire, you can effortlessly identify problems and optimize resources within your infrastructure. Hosted Graphite by MetricFire removes the burden of self-hosting your monitoring solution, allowing you more time and freedom to work on your most important tasks.
Once you have signed up for a Hosted Graphite account and used the above steps to configure your server(s) with the Telegraf Agent, metrics will be forwarded, timestamped, and aggregated into the Hosted Graphite backend.
-
Metrics will be sent and stored in the Graphite format of: metric.name.path <numeric-value> <unix-timestamp>
-
The dot notation format provides a tree-like data structure, making it efficient to query
-
Metrics are stored in your Hosted Graphite account for two years, and you can use them to create custom Alerts and Grafana dashboards.
Build Dashboards in Hosted Graphite's Hosted Grafana
In the Hosted Graphite UI, navigate to Dashboards => Primary Dashboards and select the + button to create a new panel. Then you can use the query UI in Edit mode to select a graphite metric path (the default data source will be the HostedGraphite backend if you are accessing Grafana via your HG account). The Hosted Graphite datasource also supports wildcard (*) searching to grab all metrics that match a specified path. The Graphite function aliasByNode() was also applied, to reformat the name.
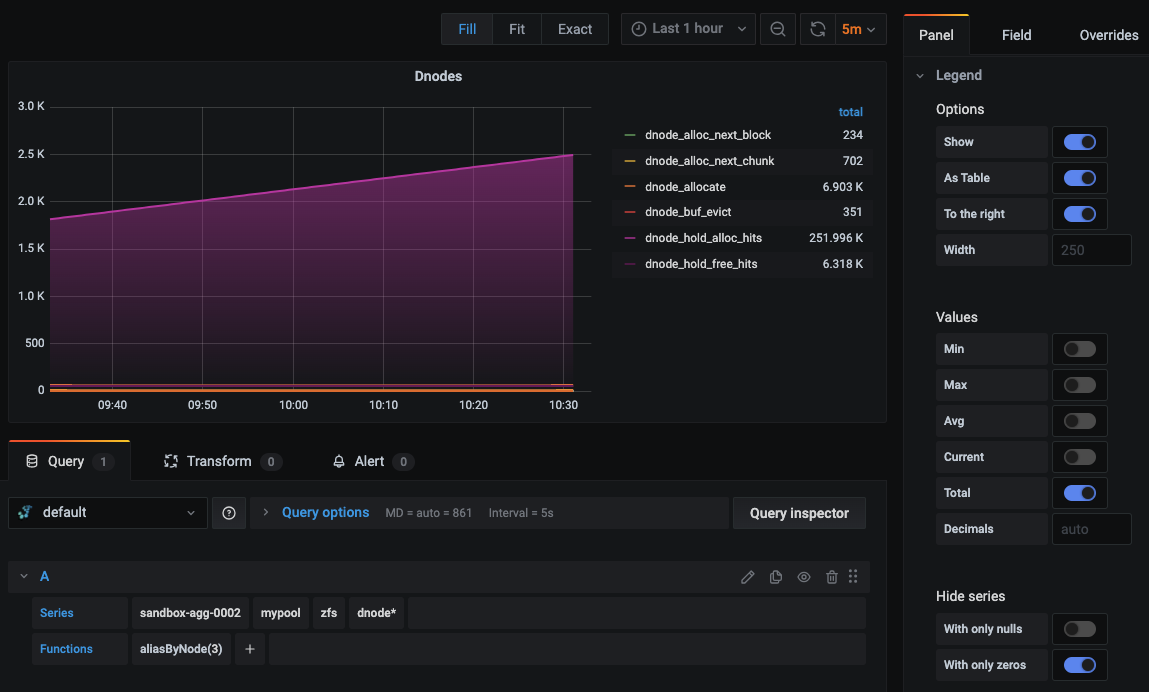
Additionally, Grafana has many additional options to apply different visualizations, modify the display, set units of measurement, and some more advanced features like configuring dashboard variables and event annotations.
See the Hosted Graphite dashboard docs for more details.
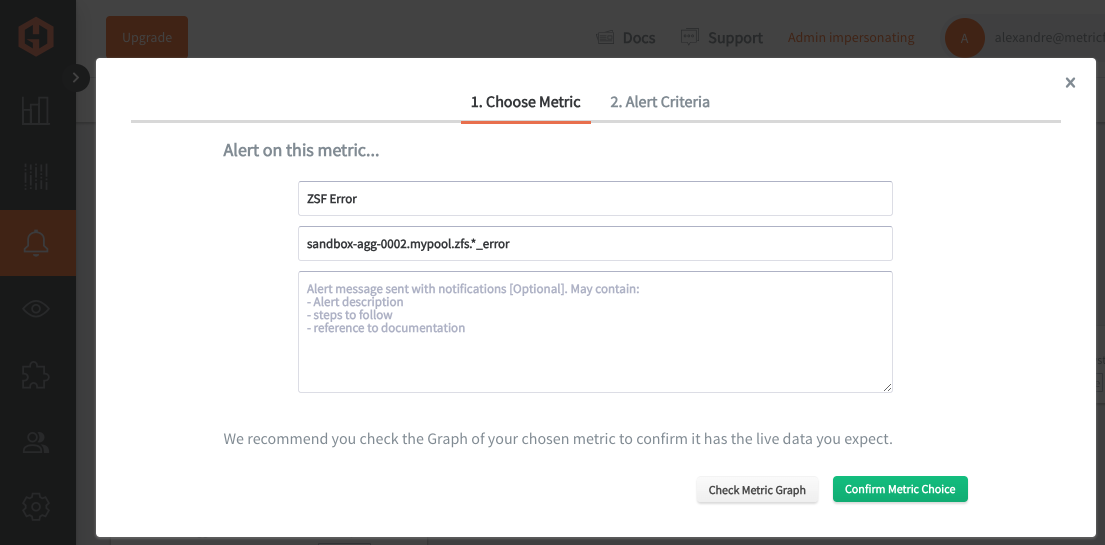
Creating Graphite Alerts
In the Hosted Graphite UI, navigate to Alerts => Graphite Alerts to create a new alert. Name the alert, add a query to the alerting metric field, and add a description of what this alert is:
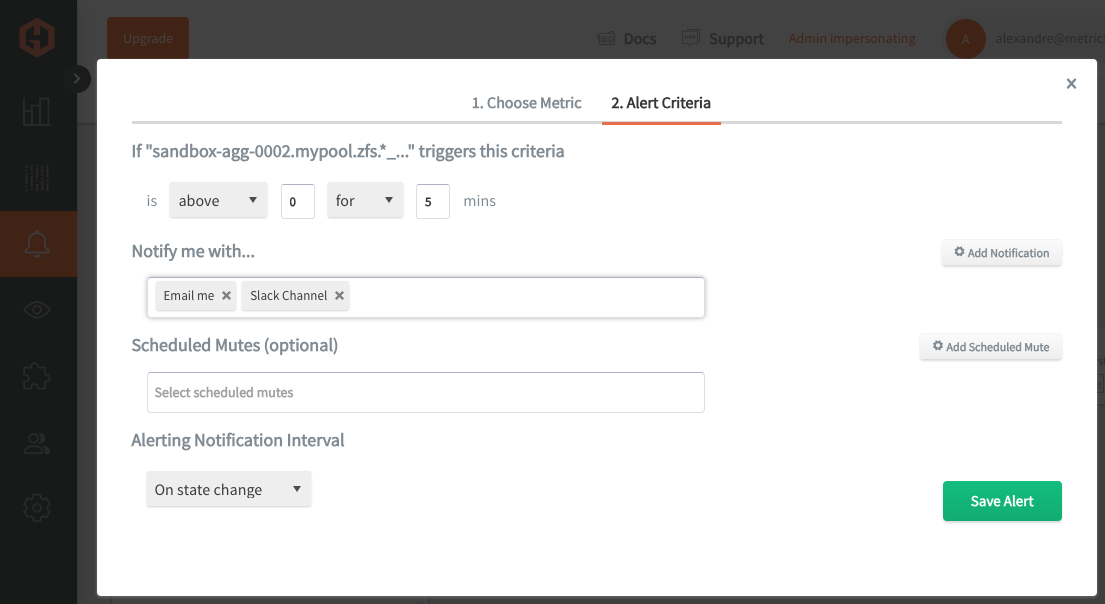
Then, select the Alert Criteria tab to set a threshold and select a notification channel. The default notification channel will be the email you used to sign up for the Hosted Graphite account. Still, you can easily configure channels for Slack, PagerDuty, Microsoft Teams, OpsGenie, custom webhooks and more. See the Hosted Graphite docs for more details on notification channels:
Conclusion
Monitoring ZFS across your business's server infrastructure is crucial for ensuring data integrity, optimizing performance, and maintaining system reliability. It provides valuable insights into memory usage, data allocation, and potential issues like data corruption or disk failures. By actively monitoring ZFS metrics, businesses can proactively manage resources, prevent downtime, and ensure the efficient operation of their storage systems, which is essential for supporting critical applications and safeguarding valuable data.
Tools like dashboards and alerts will complement your data by providing real-time visualization, proactive identification of issues, historical trend analysis, and facilitating informed decision-making, all essential for maintaining a robust and efficient infrastructure.
Sign up for the free trial and begin monitoring your infrastructure today. You can also book a demo and talk to the MetricFire team directly about your monitoring needs.