
Table of Contents
Great systems are not just built. They are monitored.
MetricFire runs Graphite and Grafana as a fully managed service for growing engineering teams, taking care of storage, scaling, and version updates so your team doesn't have to. Plans start at $19/month, billed per metric namespace rather than per host, and include engineer-staffed support. Integrations work natively with Heroku, AWS, Azure, and GCP, and data is stored with 3× redundancy in SOC2- and ISO:27001-certified data centres.
Introduction
At MetricFire, we love talking with engineers about their tech stacks, SRE challenges, and how they approach infrastructure monitoring. Recently, we had a great chat with Yoimer Roman from a Latin American cloud consulting company, that helps clients make smarter business decisions by leveraging AWS CloudWatch monitoring. Yoimer wears many hats: mentoring his team on all things AWS, designing custom cloud environments, and bridging the gap between technical challenges and non-technical stakeholders. He’s passionate about monitoring, observability, and making AWS work for businesses of all sizes.
If monitoring is your thing and you’ve got insights to share, let’s talk! We’d love to hear your story.
How Yoimer Uses CloudWatch
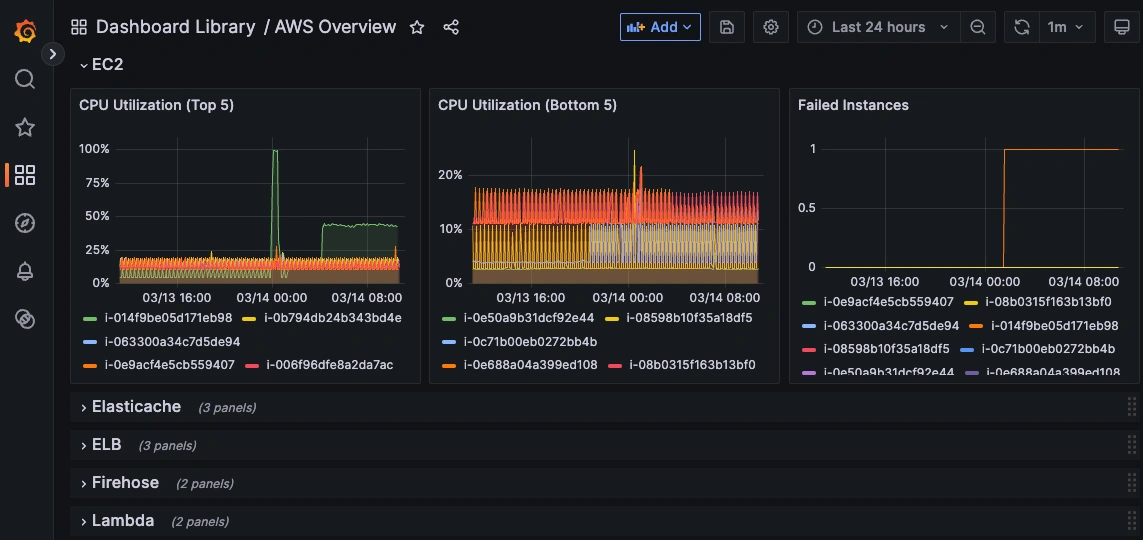
At his company, Yoimer manages observability for multiple clients, helping them save money and proactively monitor their AWS environments. He’s built a CloudWatch-based monitoring solution that gives deep visibility into his clients' infrastructure with the primary goal of optimizing costs. Their focus is to help them understand their infrastructure and make smarter, cost-effective decisions. Some of his customers are not deeply technical so by leveraging AWS CloudWatch, he monitors key metrics for his them to ensure that they only pay for what they need.
Our conversation covered CloudWatch, EC2, RDS, Lambda, and ALBs, which are all areas in which Yoimer brings serious expertise. He focuses on finding cost-saving strategies and rather than waiting for outages, Yoimer’s approach is proactive. He sets up automated alerts and cost thresholds so his team can detect anomalies, scale resources efficiently, and prevent unnecessary spending before issues arise. To streamline alerting, he also leverages Terraform to automate alarms with his monitoring workflow.

"It's easy, because you just have to add a CloudWatch policy on the EC2 instance profile. For example, let's say that you want to monitor the CPU utilization metric - and that's it. As long as you configure the threshold for that metric, you generate an alarm. And if the CPU utilization goes beyond the threshold, you configure, let's say, 80% of the CPU utilization, it's going to eventually trigger the alarm through AWS EventBridge. And then you do with that information whatever you want. We process it through a Lambda and generate Slack notifications automatically."
Automating Alarms & Scaling
To simplify infrastructure management, Yoimer automates CloudWatch alarms and scaling policies using Terraform, making it easier to deploy monitoring across multiple AWS accounts. His Terraform templates handle ALB target groups, EC2 monitoring, and Lambda thresholds, reducing manual setup and keeping everything consistent. Plus, by storing Terraform state files in S3, he ensures smooth infrastructure updates without disrupting customer environments. It’s all about efficiency and making AWS monitoring as hands-off as possible.
"As a best practice, the key is proactive monitoring. I don't like waiting until a customer calls me at 3 AM telling me their service is down and they are losing money. I need to understand their core business, how they generate revenue, and then translate that into key technical monitoring metrics. If they're using SQS, managing queues, or analyzing data with Kinesis, we make sure those critical components are monitored in real-time. Constant, proactive monitoring is what keeps everything running smoothly."
While Terraform improves efficiency, he acknowledges that some clients prefer manual AWS configurations, requiring a balance between automation and traditional workflows. His cost-optimization strategy includes analyzing CloudWatch logs, identifying underutilized resources, and modifying instance types to reduce expenses. By leveraging AWS Savings Plans and Reserved Instances, he helps businesses lower their AWS bills while maintaining performance. This approach ensures that monitoring remains proactive, automated, and scalable.
Yoimer's Experience With IoT, AWS, and FreeRTOS
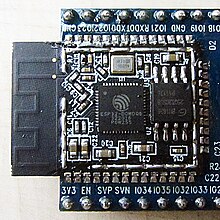
Before becoming an AWS expert, Yoimer got his start in IoT development, working with ESP32 microcontrollers and AWS FreeRTOS. He used FreeRTOS to collect sensor data like temperature, humidity, pressure, and GPS tracking. He would then publish it to AWS IoT Core via MQTT, making device management much easier.
To handle large-scale data ingestion, he configured a Raspberry Pi as an IoT gateway, pushing data into DynamoDB. One of the many challenges in IoT can be firmware updates. Yoimer solved this by implementing over-the-air updates with S3 buckets, even building a rollback mechanism to restore stable firmware if an update failed. To make this IoT data accessible across his organization, he leveraged DreamFactory to provide governed API access to the sensor data stored in DynamoDB, enabling different applications and teams to securely query device information without direct database access.
To bring it all together, he worked with frontend developers to build an interactive dashboard that mapped device locations, displayed real-time status updates, and triggered alerts when devices lost connectivity. This project bridged embedded systems with cloud infrastructure, highlighting Yoimer’s ability to combine hardware, cloud, and automation into a seamless device monitoring solution.
Exploring MetricFire's Hosted Graphite Platform
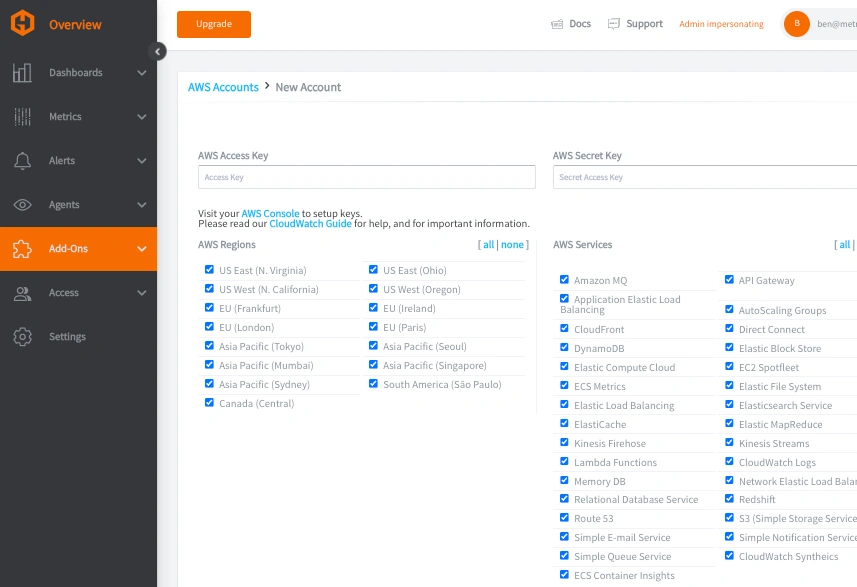
With the rising costs of AWS CloudWatch, Yoimer began exploring more cost-effective monitoring solutions like MetricFire’s Hosted Graphite. What stands out to him is MetricFire’s public ingestion endpoint, which makes it easy to consolidate data from multiple sources - unlike AWS, where costs can quickly add up based on the number of metrics and data ingestion volume. Unlike CloudWatch’s pricing model, which is based on API calls, MetricFire charges based on unique metric namespaces stored, potentially offering significant cost savings. MetricFire pulls data from CloudWatch, converts it into Graphite metrics, and stores it efficiently, which allows users to query their data freely without repeatedly hitting CloudWatch APIs.
"I use AWS Budgets and if after two weeks the entire budget exceeds, I don’t know, 35K, I get an email. Or if we’re consuming $500 every day, I get an alert. That’s when I start diving deep into cost optimization - reducing unused instances, implementing saving plans, or using reserved instances. But the real decision-making comes from monitoring. Keeping an eye on CPU, memory, and network traffic tells me if we can downsize an instance without impacting performance. Monitoring drives cost efficiency."
He also appreciates that MetricFire doesn’t require CloudFormation templates or intrusive permissions, and offers an easy to use interface making it easy to integrate with existing AWS environments. While CloudWatch remains a powerful tool, businesses with high monitoring expenses may benefit from switching to a more budget-friendly alternative. If MetricFire proves to be a viable replacement for certain workloads, Yoimer is open to adopting it as part of his broader AWS cost-optimization strategy.
Conclusion
Yoimer Roman’s approach to AWS monitoring is a masterclass in automation, cost optimization, and proactive alerting. From CloudWatch-based monitoring and Terraform automation to scaling infrastructure efficiently, he ensures businesses get the insights they need without breaking the bank. His background in IoT monitoring showcases his ability to integrate embedded systems with the cloud, while his mentorship helps shape the next generation of AWS engineers.
Beyond AWS, Yoimer is always exploring new ways to optimize costs and improve visibility, including monitoring solutions like MetricFire. Whether it's through CloudWatch, Terraform, or alternative platforms, his focus remains the same by building reliable, scalable, and cost-effective monitoring solutions that keep businesses operating within their budget and ahead of potential issues.

