Table of Contents
Introduction
In a previous blog, we learned about setting up a Scalable Prometheus-Thanos monitoring stack. We also learned about how we can cluster multiple Prometheus servers with the help of Thanos and then deduplicate metrics and alerts across them.
MetricFire offers a Prometheus alternative solution, and you can use our product with minimal configuration to gain in-depth insight into your environment. If you would like to learn more about it please book a demo with us, or sign up for the free trial today.
Today we will go a step beyond and extend the view of our monitoring stack so that we can monitor multiple Kubernetes clusters at once.
Key Takeaways
- Multi-cluster monitoring is crucial for maintaining a robust Kubernetes environment, allowing you to detect anomalies early and benchmark application performance across different clusters.
- The implementation involves using Helm charts to deploy Prometheus and Thanos components across clusters, with Thanos queriers connecting them.
- Multiple Thanos Store Gateways can be used for secure global views, and each gateway can be configured to point to specific Long Term Storage buckets.
- Thanos offers solutions for Prometheus High Availability, clustering, data archiving, and hot reloads for Prometheus configurations.
- Monitoring is essential for any application stack, and MetricFire is mentioned as a tool that can help monitor applications across various environments.
The need for Multi-Cluster Monitoring
A robust Kubernetes environment consists of more than 1 Kubernetes cluster. It is very important from an operations perspective to monitor all these clusters from a single pane of glass. This not only helps detect anomalies early on but you can also benchmark applications performance in different environments.
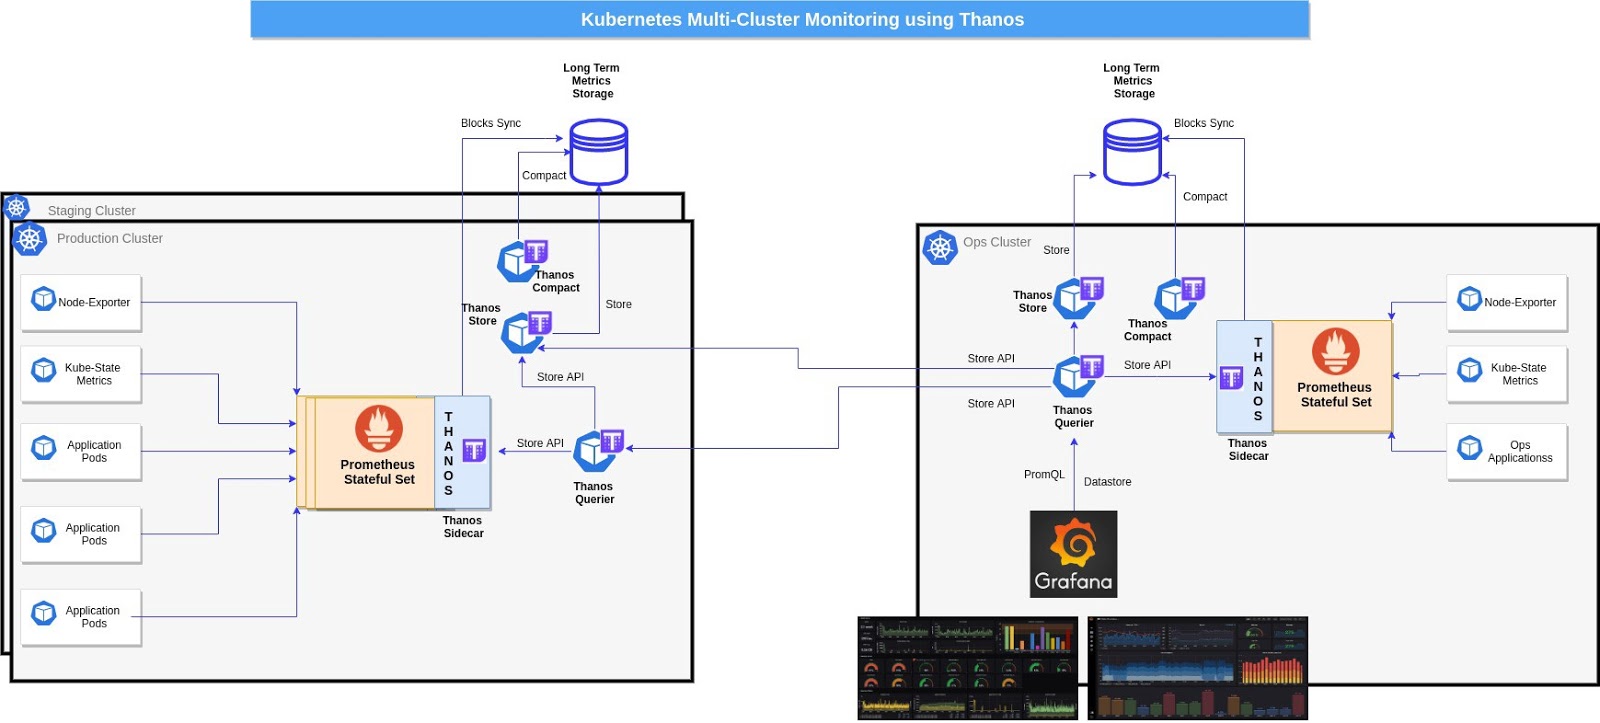
It can be visualized like this:
The image above shows a situation where we are monitoring multiple clusters (prod, staging, etc.) from a single Ops Cluster. However, at the same time, the monitoring set-up in each cluster is very robust and complete - we can always view these metrics separately should the need arise. Let's take a look at how we can build this!
Prerequisite for the set-up
In order to completely understand this tutorial, the following are needed:
- Working knowledge of Kubernetes and using kubectl.
- A Kubernetes cluster with at least 3 nodes (for the purpose of this demo a GKE cluster is being used).
- Implementing Ingress Controller and ingress objects (for the purpose of this demo Nginx Ingress Controller is being used). Although this is not mandatory, it is highly recommended in order to decrease the number of external endpoints created.
Implementation
To get started, run
git clone https://github.com/Thakurvaibhav/k8s.git
kubectl create ns monitoring
Next,
- Create 2 GCS buckets and name them as prometheus-long-term and thanos-ruler.
- Create a service account with the roles as Storage Object Creator and Storage Object Viewer.
- Download the key file as json credentials and name it as thanos-gcs-credentials.json.
- Create kubernetes secret using the credentials,
kubectl create secret generic thanos-gcs-credentials --from-file=thanos-gcs-credentials.json -n monitoring - Please update the domain name for the ingress objects, sed -i -e s/<your-domain>/yourdomain/g k8s/monitoring/prometheus-ha/values.yaml
Deploy Resources
helm upgrade --install <RELEASE_NAME> prometheus-ha/
You should be able to check all the pods as follows:
$ kubectl get pods
NAME                                  READY   STATUS    RESTARTS   AGE
alertmanager-6d6585568b-tvsgs         1/1     Running   0          14d
grafana-0                             1/1     Running   0          14d
kube-state-metrics-7f9594d45c-xfl8n   2/2     Running   0          14d
node-exporter-27dc6                   1/1     Running   0          14d
node-exporter-l5wbh                   1/1     Running   0          14d
node-exporter-q766x                   1/1     Running   0          14d
node-exporter-rpgl5                   1/1     Running   0          14d
prometheus-0                          2/2     Running   0          14d
pushgateway-6c97584d4c-fmnzx          1/1     Running   0          14d
thanos-compactor-0                    1/1     Running   0          14d
thanos-querier-56b448d499-vtbx7       1/1     Running   0          3d
thanos-ruler-0                        1/1     Running   0          14d
thanos-store-gateway-0                1/1     Running   0          14d
If we fire up an interactive shell in the same namespace as our workloads to check which pods thanos-store-gateway resolves, you will see something like this:
root@my-shell-95cb5df57-4q6w8:/# nslookup thanos-store-gateway

Server:  10.63.240.10
Address: 10.63.240.10#53
Name: thanos-store-gateway.monitoring.svc.cluster.local
Address: 10.60.25.2
Name: thanos-store-gateway.monitoring.svc.cluster.local
Address: 10.60.25.4
Name: thanos-store-gateway.monitoring.svc.cluster.local
Address: 10.60.30.2
Name: thanos-store-gateway.monitoring.svc.cluster.local
Address: 10.60.30.8
Name: thanos-store-gateway.monitoring.svc.cluster.local
Address: 10.60.31.2

root@my-shell-95cb5df57-4q6w8:/#
The IPs returned above correspond to our Prometheus pods, thanos-store and thanos-ruler. This can be verified as:
$ kubectl get pods -o wide -l thanos-store-api="true"

NAME                     READY   STATUS    RESTARTS   AGE    IP           NODE                              NOMINATED NODE   READINESS GATES
prometheus-0             2/2     Running   0          100m   10.60.31.2   gke-demo-1-pool-1-649cbe02-jdnv   <none>           <none>
thanos-ruler-0           1/1     Running   0          100m   10.60.30.8   gke-demo-1-pool-1-7533d618-kxkd   <none>           <none>
thanos-store-gateway-0   1/1     Running   0          14h    10.60.25.4   gke-demo-1-pool-1-4e9889dd-27gc   <none>           <none>
Once Grafana is running:
- Access grafana at grafana.<your-domain>.com
- You should be able to see some dashboards baked in. You can always customize them or add more.
Now, in order to monitor another kubernetes cluster in the same pane do the following: Deploy all the components except for Grafana in your second cluster.
- Make sure you update the cluster name in the values.yaml at prometheus.clusterName.
- Expose Thanos querier on port 10901 of the second cluster to be accessible from the first cluster.
- Update the Querier deployment in the first cluster to query metrics from the second cluster. This can be done by adding the store endpoint (alternatively Query endpoint can also be used) to the Querier deployment of the first cluster. This parameter can be set in the values.yaml as thanos.query.extraArgs.
# Update the querier container's argument and add the following
- --store <IP_THANOS_QUERY_CLUSTER_2>:10901
# Alternatively you can also use dns name as following
- --store dns+<DNS_STORE_GATEWAY_CLUSTER_2>:10901
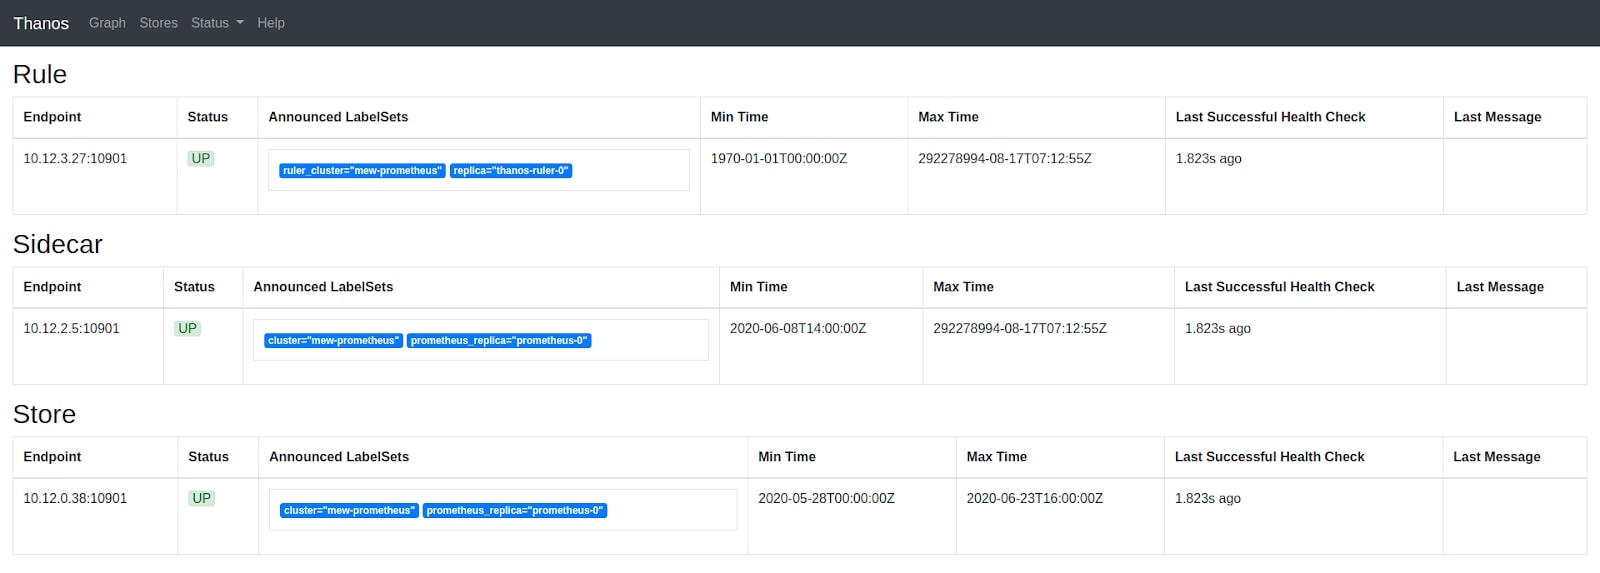
Once the querier deployment is updated the new store gateway should appear under the Stores tab on the UI.
You should be able to access thanos querier at thanos-querier.<your-domain>.com
All the available stores should appear on the Thanos Query dashboard.

Store Endpoints discovered by Thanos Query
When we add more store arguments to the Thanos Query container as shown above, we can see additional query servers from which metrics for those clusters can be scraped.

Scraping metrics from Thanos query of other clusters
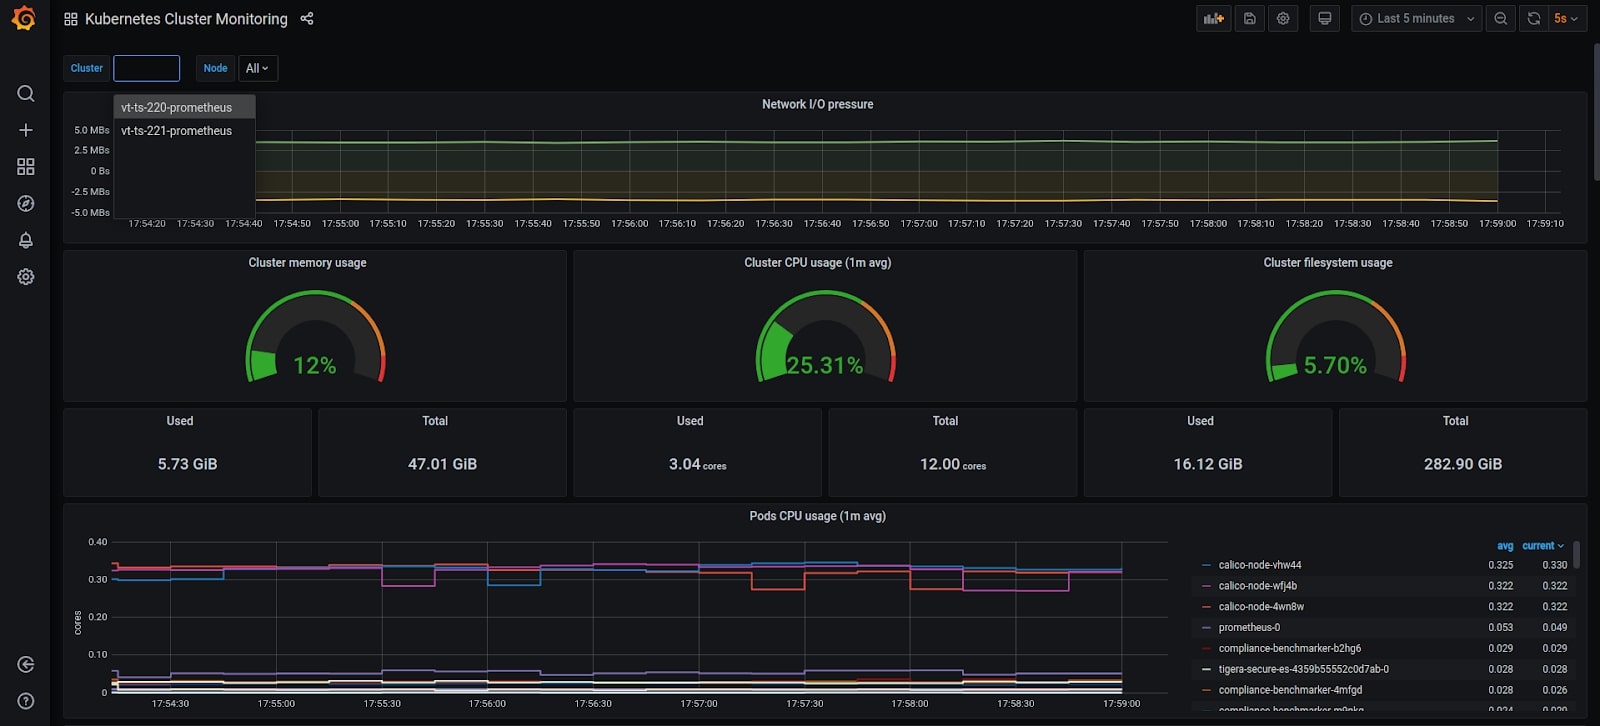
Finally, the metrics for all clusters can be visualized in the same Grafana dashboard which can be filtered for each cluster:

Grafana dashboard showing metrics for all available clusters
Discovering Remote Clusters
As we learned above, configuring Thanos to pull metrics from the Remote cluster is fairly easy. However, in the case of production scenarios establishing network connectivity between those clusters could be a challenge. Let’s explore how we can solve this problem.
Scenario I: Kubernetes Clusters in the Same VPC
This is the scenario when we have an ops kubernetes cluster monitoring other kubernetes clusters and all of these are in the same VPC. In this case, we can expose the Thanos query grpc service using an Internal Load Balancer. Setting it up is as easy as applying an annotation.
For example, in the case of GCP we can use the following service manifest:
apiVersion: v1
kind: Service
metadata:
  annotations:
    cloud.google.com/load-balancer-type: Internal
  labels:
    app: thanos-querier
  name: thanos-querier-scrape
  namespace: monitoring
spec:
  type: LoadBalancer
  ports:
  - port: 10901
    protocol: TCP
    targetPort: grpc
    name: grpc
  selector:
    app: thanos-querier
In the case of Amazon Web Services clusters set up using EKS or KOPS we can use the following annotation:
service.beta.kubernetes.io/aws-load-balancer-internal: "true"
We should also ensure that the firewall rules for the nodes in the VPC allow access to port 10901 from other nodes in the same VPC.
Additionally, this service can be exposed using a Nginx-Ingress Load balancer which can be either Internal Facing or External Facing. However, the configmap for the Nginx-Ingress Load balancer will look something like this:
kind: ConfigMap
apiVersion: v1
metadata:
  name: tcp-services
  namespace: ingress-nginx
data:
  18363: "monitoring/thanos-querier-scrape:10901"
Furthermore, the Ingress Controller service would look something like this:
kind: Service
apiVersion: v1
metadata:
  annotations:
    cloud.google.com/load-balancer-type: Internal
  name: ingress-nginx
  namespace: ingress-nginx
  labels:
    app: ingress-nginx
spec:
  type: LoadBalancer
  selector:
    app: ingress-nginx
  ports:
  - name: http
    port: 80
    targetPort: http
  - name: https
    port: 443
    targetPort: https
  - name: proxied-tcp-18363
    port: 18363
    targetPort: 18363
    protocol: TCP
Scenario II: Kubernetes Clusters in Different VPC of the same Public Cloud
If we have our Kubernetes clusters running in the same public cloud but with different VPC or networks then we can always set up VPC Peering among them. With the help of VPC peering we can discover services exposed internally to a particular VPC network from the peered VPC network. This strategy works effectively and is extremely easy to implement.
In the case of GCP, you can read here about vpc peering. For AWS please go through this documentation.
Scenario III: Kubernetes Clusters in Different Public Clouds

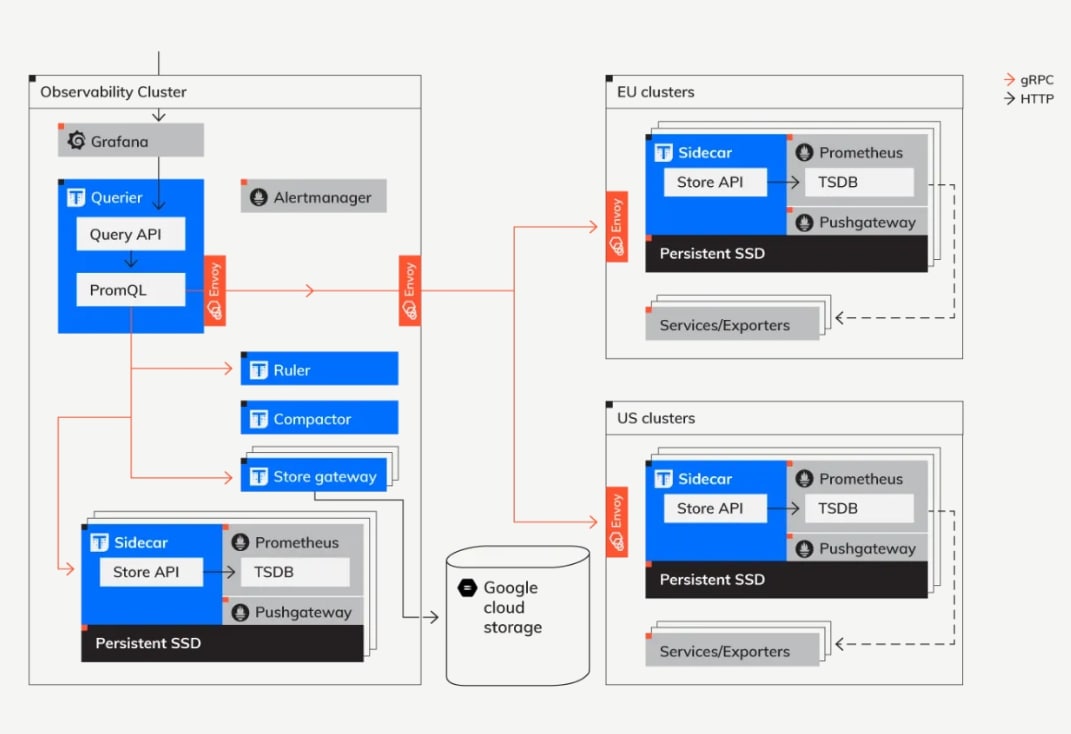
The above diagram presents the overall, high-level architecture of the Thanos deployments that serves as a centralized, global metric system for all internal engineers.
In this architecture, from Thanos' perspective, we can distinguish two types of clusters: the “Observability” cluster and dozens of “Client” clusters. The key part is that those Client clusters do not need to be co-located geographically with the Observability one. Some of them are in the US, some in the EU, and some in other parts of the world. They don’t need to be running in the same cloud provider or using a homogenous orchestration system.
The right-hand side, the client cluster side, is any cluster that is “monitored” using our Thanos deployment. Once the client cluster has been deployed, the clusters expose all their metrics to the Observability cluster via gRPC and optionally by uploading them to object storage.
By contrast, the Observability cluster acts as a central entry point for our internal engineers. This is where the dashboards, alert routing, and ad-hoc queries are run. Thanks to Thanos, our engineers can perform “global view” queries; that is, PromQL queries that require data from more than one Prometheus server.
To connect clusters that can be running in different regions and zones, we use Envoy proxy to propagate traffic. Envoy allows a reliable, controlled, and very simple-to-configure connection. Furthermore, Envoy proxy comes bundled with Istio Service Mesh which can be easily deployed in the cluster and services can be exposed securely.
It is important to note that this strategy can be used for all the 3 scenarios stated above - but yes, it adds to some implementation complexity.
Another strategy for a secure Global view of all clusters is to run multiple Thanos Store Gateways in the Ops cluster. It is important to keep in mind that each Store Gateway should be pointing to the Long Term Storage bucket for whichever cluster you would like to monitor. If all clusters share the Long Term Storage bucket, then configuration is a little easier, but it might not please your organization’s compliance team.
For example, a sample store gateway’s config could look like this:
apiVersion: apps/v1
kind: StatefulSet
metadata:
  name: thanos-store-gateway
  namespace: monitoring
  labels:
    app: thanos-store-gateway
spec:
  replicas: 1
  selector:
    matchLabels:
      app: thanos-store-gateway
      thanos-store-api: "true"
  serviceName: thanos-store-gateway
  template:
    metadata:
      labels:
        app: thanos-store-gateway
        thanos-store-api: "true"
    spec:
      containers:
        - name: thanos
          image: quay.io/thanos/thanos:v0.12.1
          args:
          - store
          - --grpc-address=0.0.0.0:10901
          - --http-address=0.0.0.0:10902
          - --data-dir=/data
          - "--objstore.config={type: GCS, config: {bucket: cluster1_bucket }}"
          env:
            - name : GOOGLE_APPLICATION_CREDENTIALS
              value: /etc/secret/thanos-gcs-credentials.json
          ports:
          - name: http
            containerPort: 10902
          - name: grpc
            containerPort: 10901
          livenessProbe:
            failureThreshold: 4
            httpGet:
              path: /-/healthy
              port: 10902
              scheme: HTTP
            periodSeconds: 30
          readinessProbe:
            httpGet:
              path: /-/ready
              port: 10902
              scheme: HTTP
          terminationMessagePolicy: FallbackToLogsOnError
          volumeMounts:
            - name: thanos-gcs-credentials
              mountPath: /etc/secret
              readOnly: false
      volumes:
        - name: thanos-gcs-credentials
          secret:
            secretName: thanos_gcs_secret
One downside of using this approach is that live metrics won’t be available from any of the remote clusters because the Thanos sidecar uploads data in 2-hour chunks. This strategy is effective when we want to get a view of historical data for a particular cluster. The upside to using this is that the configuration and setup are extremely easy and fast.
Conclusion
Thanos offers a simple solution to enable Prometheus High Availability and Clustering. Along with that, it also offers distinct advantages like data archiving and hot reloads for Prometheus configuration. Such a monitoring stack can accelerate your multi-cloud multi-cluster kubernetes journey and you can deploy applications with confidence. Setting it up is extremely simple.
If you need help setting up these metrics feel free to reach out to me through LinkedIn. Additionally, MetricFire can help you monitor your applications across various environments. Monitoring is extremely essential for any application stack, and you can get started with your monitoring using MetricFire’s free trial. Robust monitoring will not only help you meet SLAs for your application but also ensure a sound sleep for the operations and development teams. If you would like to learn more about it please book a demo with us.


