Table of Contents
Great systems are not just built. They are monitored.
MetricFire hosts Graphite & Grafana as a managed service for small engineering teams, taking care of storage, scaling and version updates. Pricing starts at $19/month, billed per namespace metric instead of per host, with engineer-staffed support. Heroku, AWS, Azure, and GCP are natively integrated. We store your data with 3× redundancy in SOC2- and ISO:27001-certified data centres.
Introduction
Looking for a straightforward way to collect NGINX metrics with OpenTelemetry and send them to your Graphite-based monitoring setup? Unlike Prometheus, which requires configuring scrape jobs and query language nuances, Carbon/Graphite offers a simpler setup with minimal overhead—just send metrics as plain text and query them easily with familiar tools like Grafana. Whether you're setting up dashboards, alerts, or just keeping an eye on traffic, this guide will get you actionable insights in no time!
In this article, we'll detail how to install the OpenTelemetry Collector, and configure it to scrape and export NGINX (Prometheus) metrics to a Carbon endpoint.
Get Up and Running With NGINX
NGINX is a lightweight, high-performance web server and reverse proxy that excels at handling massive traffic loads without eating up resources. Its popularity has skyrocketed thanks to its speed, built-in load balancing, and seamless support for microservices. As cloud-native apps and containerized deployments take over, NGINX has become a go-to tool for devs looking for scalability, security, and rock-solid reliability.
Install/Configure NGINX (Linux)
This article assumes that you are already running an instance of NGINX on your server, but if you want to just follow along for testing purposes, here's how to get this up and running quickly on a Linux server:
sudo apt install -y nginx
By default, it listens on port 80—but if something else is hogging that port, check with:
sudo netstat -tulnp | grep :80
Update the NGINX config to enable stub_status, and update to an available port (if needed) by modifying the server {} block of the config file (generally located at: /etc/nginx/sites-available/default):
server {
    listen 80 default_server;
    listen [::]:80 default_server;

    location /nginx_status {
        stub_status;
        allow 127.0.0.1;
        deny all;
    }
}
Save, exit, and restart NGINX:
sudo systemctl restart nginx
sudo systemctl status nginx
Test the endpoint to see if it's working:
curl http://localhost:80/nginx_status
Install/Configure NGINX Prometheus Exporter
The nginx_exporter transforms NGINX data into properly labeled Prometheus metrics, which will later be converted again into Graphite metrics - via OpenTelemetry. It then exposes them via an HTTP endpoint, so OpenTelemetry can scrape the data.
Why send NGINX Prometheus metrics?
- Because this is a good example of how to work with Prometheus data in general. It will help you get an understanding of how to send Prometheus metrics to a scrapeable endpoint, and use the OTel Prometheus Receiver to collect and forward them. In a production-level configuration, you would probably just use the NGINX Receiver in your OTel configuration - see our related blog article for this method HERE.
Grab the latest release of the nginx-prometheus-exporter, this is a distribution that should work for most Linux systems (AMD):
wget https://github.com/nginxinc/nginx-prometheus-exporter/releases/download/v1.4.1/nginx-prometheus-exporter_1.4.1_linux_amd64.tar.gz
Extract & move it to /usr/local/bin/ (to make it easier to execute), and assign proper permissions:
tar -xzvf nginx-prometheus-exporter_1.4.1_linux_amd64.tar.gz

sudo mv nginx-prometheus-exporter /usr/local/bin/
sudo chmod +x /usr/local/bin/nginx-prometheus-exporter
Start it manually to make sure the service runs:
/usr/local/bin/nginx-prometheus-exporter -nginx.scrape-uri http://localhost:80/nginx_status
If all goes well, metrics should now be available at the default endpoint of: http://localhost:9113/metrics
curl http://localhost:9113/metrics
You can also configure nginx_exporter as a systemd service to run in the background. Otherwise, you can leave it running and open a new terminal window to follow along with the next steps.
Install and Configure OpenTelemetry
OpenTelemetry as an agent collects, processes, and exports system metrics, making it easy to track the performance across your infrastructure without extra dependencies. It pulls data using built-in scrapers, can apply transformations, and ships it straight to your preferred backend—no manual parsing or custom scripts needed. This article assumes that you are already using OpenTelemetry, but below are examples on how to install/configure otelcol-contrib so you can quickly and easily get system metrics to a carbon endpoint.
Install OpenTelemetry Contrib (Linux)
/etc/otelcol-contrib/Ubuntu/Debian (AMD)
wget https://github.com/open-telemetry/opentelemetry-collector-releases/releases/download/v0.118.0/otelcol-contrib_0.118.0_linux_amd64.deb

sudo dpkg -i otelcol-contrib_0.118.0_linux_amd64.deb
RedHat/CentOS (AMD)
wget https://github.com/open-telemetry/opentelemetry-collector-releases/releases/download/v0.119.0/otelcol-contrib_0.119.0_linux_amd64.rpm

sudo rpm -ivh otelcol-contrib_0.119.0_linux_amd64.rpm
Confirm Installation
otelcol-contrib --version
Configure the Prometheus Receiver and Carbon Exporter
The Prometheus Receiver in OpenTelemetry collects metrics from scrape endpoints, processes them, and forwards them to configured exporters. A great way to collect and forward most Prometheus data!
The Carbon Exporter takes those metrics and ships them straight to Graphite-compatible backends, making it easy to integrate OpenTelemetry into existing monitoring stacks with minimal setup.
If you're not currently hosting your own Graphite data source, start a 14-day free trial with Hosted Graphite by MetricFire to follow along.
A MetricFire account will provide the Graphite data source and include Hosted Grafana as a visualization tool - along with Alerting, Integrations, and Team features.
- First, find the configuration file generally located at: /etc/otelcol-contrib/config.yaml and open it in your preferred text editor.
- Then you can either replace the file, or add the following sections to your current config (NOTE: be sure to include your HG-API-KEY and HOSTNAME):
receivers:
  prometheus:
    config:
      scrape_configs:
        - job_name: "prometheus"
          scrape_interval: 30s
          static_configs:
            - targets:
                - "localhost:9113"  # NGINX Exporter

processors:
  batch: {}
  metricstransform:
    transforms:
      - include: ".*"
        match_type: regexp
        action: update
        new_name: "<HG-API-KEY>.opentel.$$0"
        operations:
          - action: add_label
            new_label: host
            new_value: <HOSTNAME>

exporters:
  carbon:
    endpoint: "carbon.hostedgraphite.com:2003"
    timeout: 10s

service:
  pipelines:
    metrics:
      receivers:
        - prometheus
      processors:
        - batch
        - metricstransform
      exporters:
        - carbon
Now, just save the file and restart the otelcol-contrib service:
sudo systemctl restart otelcol-contrib
sudo systemctl status otelcol-contrib
Or you can server the file manually - to troubleshoot potential configuration errors:
otelcol-contrib --config /etc/otelcol-contrib/config.yaml
Ship Tagged Graphite Metrics
Within two minutes of restarting the otelcol-contrib service, a handful of Tagged Graphite metrics will be forwarded to your Hosted Graphite account (with the opentel prefix).
Why does OpenTelemetry export Tagged metrics to Carbon?
- Because it's core model aligns more with Prometheus-style 'labels' than Graphite's 'dot notation' formatting. Instead of flattening data into long metric names, it preserves the labels by using Graphite tags, which enables richer filtering in your Graphite backend.
Why convert Prometheus data to the Graphite format?
- Graphite’s hierarchical structure makes storing and querying metrics simpler than Prometheus’ label-based system, which can lead to high cardinality and complex queries. With predictable dot-separated names, Graphite allows for easier aggregation and visualization without extra filtering logic. Additionally, Graphite Tags enhance flexibility by enabling more efficient metric filtering and organization.
Now you can locate these Tagged Metrics in the Hosted Graphite Tag Search UI:
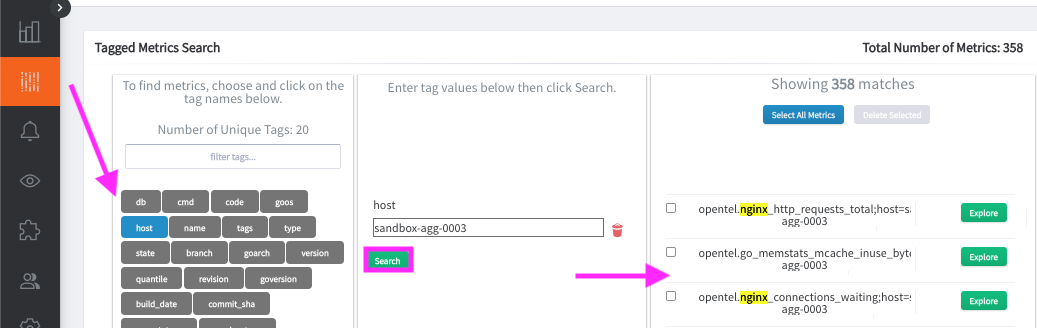
Otherwise, you can configure a different exporter to forward metrics to another data source.
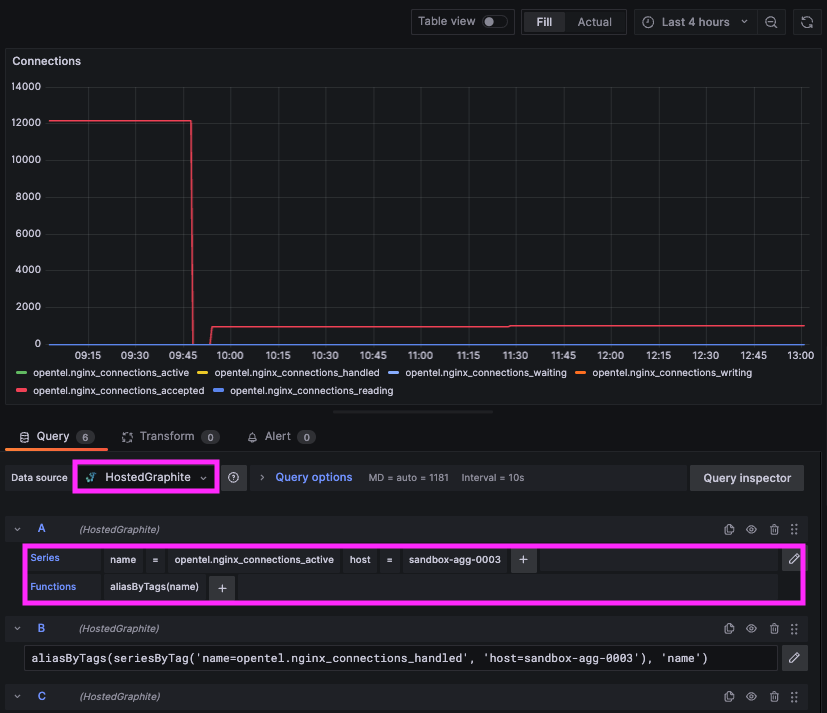
Build Custom Visualizations in MetricFire's Hosted Grafana
In the Hosted Graphite UI, navigate to Dashboards and select + New Dashboard to create a new visualization.
Then go into Edit mode and use the Query UI to select a graphite metric path (the default data source will be HostedGraphite if you are accessing Grafana via your HG account).
Considerations:
- OpenTelemetry metrics will be sent and stored in the Graphite Tag format of: my.series;tag1=value1;tag2=value2 metric_value (timestamp)
- To query Tagged metrics, you must apply the seriesByTag Graphite function.
Grafana has many additional options to apply different visualizations, modify the display, set units of measurement, and some more advanced features like configuring dashboard variables and event annotations.
Again, this article serves as an example for handling Prometheus data and converting it to Graphite via OpenTelemetry.
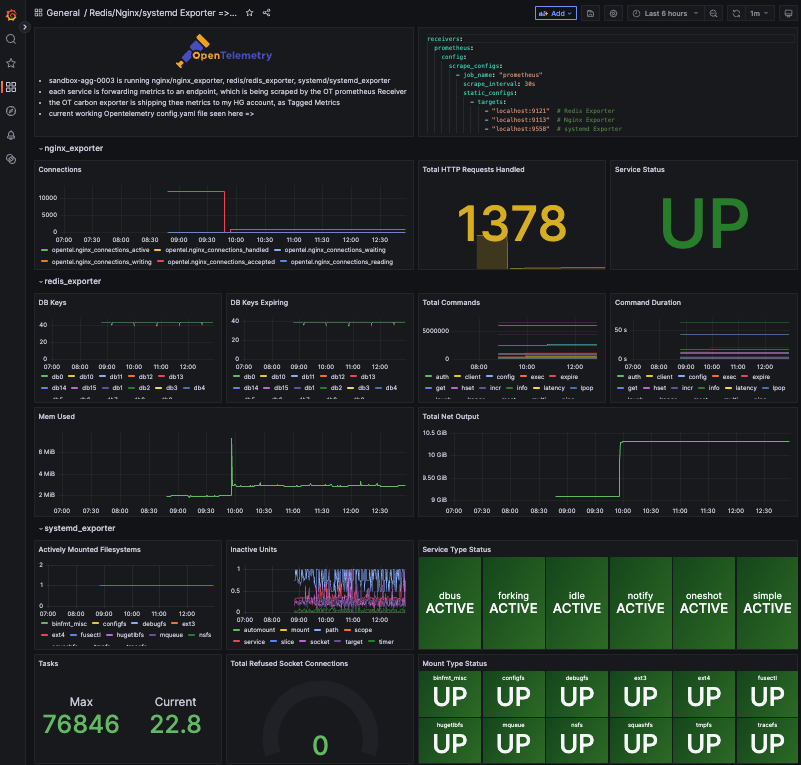
In most Graphite use cases, you would likely configure OpenTelemetry Receivers instead of the Prometheus Receiver to reduce the complexity of your setup.
However, here's an example of a production-level dashboard that is rendering data collected from NGINX/Redis/systemd Prometheus Exporters (via OpenTelemetry):
Conclusion
Keeping an eye on NGINX helps you catch issues early, optimize performance, and keep things running smoothly for users. OpenTelemetry makes it easy to monitor not just NGINX but your whole stack, giving you a complete picture of what’s happening under the hood. With NGINX metrics in OpenTelemetry, you get deeper insights, easier troubleshooting, and a more streamlined way to keep your infrastructure rock solid.
Sign up for the free trial and begin monitoring your infrastructure today. You can also book a demo and talk to the MetricFire team directly about your monitoring needs.