Table of Contents
Introduction
Graphite is an open-source time-series monitoring software that collects metrics from infrastructure and visualizes them through a web app. While it's free and open-source, it has certain limitations such as the inability to collect data from any infrastructure or analyze real-time data. MetricFire offers Hosted Graphite, an expanded version of Graphite with added features like cluster native storage, data organization with tags, team accounts and reports, deployment integrations, and alerts via multiple channels. MetricFire provides Hosted Grafana and Hosted Graphite starting at $99/month, merging the best parts of these services.
Key Takeaways
- Graphite is an open-source time-series monitoring software that collects metrics by taking information that is already being expressed - usually collecting metrics with an agent like Collectd or StatsD - and then records and visualizes it.
- Graphite's limitations include its inability to collect data from any infrastructure by itself, give real-time data analysis, and provide a utilitarian dashboard for communicating with team members.
- MetricFire is a popular platform that utilizes open-source data monitoring software to provide a more robust and powerful experience for data analysis. It provides a more refined Graphite service than the vanilla one does, and at a reasonable price. Grafana is a standard with all MetricFire plans due to its powerful, intuitive UI and abundance of features.
Graphite: a popular server monitoring software
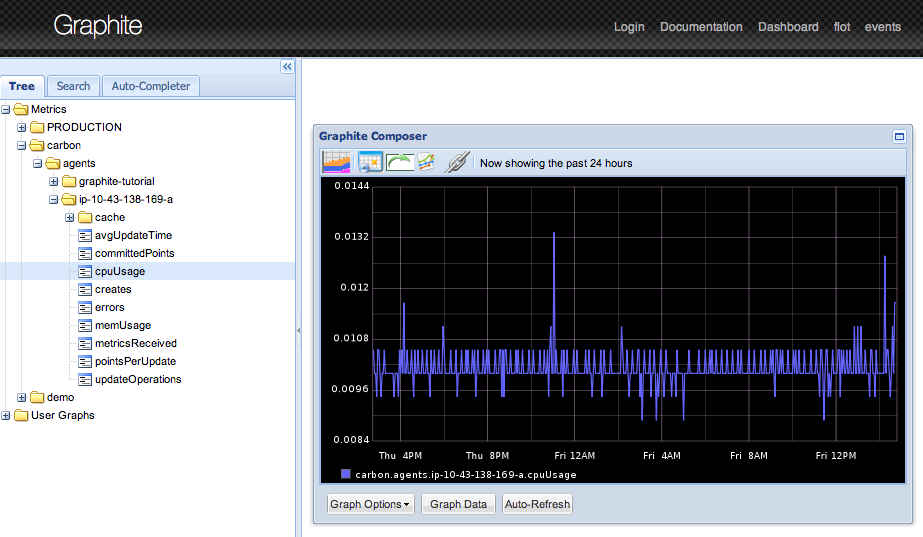
Graphite is an open-source time-series monitoring software that was first released in 2008. It’s a pull-based monitoring software, which means that it collects metrics by taking information that is already being expressed - usually collecting metrics with an agent like Collectd or StatsD - and then records and visualizes it.
Functionalities of Graphite:
- Feeding numeric time-series data to Graphite is pretty easy, and requires only a little coding.
- Graphite usually leverages StatsD or Collectd to obtain time-series numeric data from any infrastructure.
- The metrics are then aggregated and stored in Graphite’s database, Whisper.
- As you send data points to Carbon, they become immediately available for graphing in the web app where you can create and display graphs.
- Graphite allows for defining alerts on specific events.
- Graphite also has Events that support a richer form of metrics storage suitable for irregular events often associated with metadata.
- Graphite is free and open-source, and hence the go-to software for numerous companies for their data monitoring requirements.
Alternatives to Graphite
While Graphite is great for producing analysis reports and providing a database library and is free and open-source, we do face certain limitations while using it. A few key ones are:
- Graphite cannot collect data from any infrastructure by itself.
- It cannot give an analysis of real-time data.
- The dashboard is not utilitarian enough for communicating with team members.
To make up for these shortcomings, a lot of alternative data monitoring services exist and are being heavily used by organizations.
Graphite-as-a-service on MetricFire
MetricFire is a popular platform that utilizes open-source data monitoring software to provide a more robust and powerful experience for data analysis. It leverages Graphite and Grafana, two popular tools (more on the other two below) that are used by organizations for their data management tasks. Sign up for a free trial with MetricFire and check out how it looks. You can also book a demo with MetricFire and talk to the team directly.
MetricFire provides a complete infrastructure and application monitoring platform.
Hosted Graphite is one of the services on MetricFire. It expands on all the functionalities of vanilla Graphite by adding a few missing components to it:
- Graphite’s whisper storage is replaced with a cluster native storage system, also allowing for multiple redundant copies of data.
- Dataviews and data storage using tags for easy organization of metrics.
- A built-in agent for communication.
- Team accounts and reports for easier collaboration.
- Integrations to deployment platforms like Heroku, and AWS.
- Dashboard permissions for better control and access among teams.
- Alerts for actionable events via Email, Slack, Webhooks, and more.
- APIs to modify and build automated services on top of Graphite as per your needs.
- Logging tools.
MetricFire provides seamless scaling and provides a much more refined Graphite service than the vanilla one does, and at a reasonable price. Business-ready Graphite as a service starts at $99/month. It includes Hosted Graphite and Grafana dashboards for visual rendering of data.
Prometheus
Prometheus, like Graphite, is an open-source service monitoring system. It falls under the Cloud Native Computing Foundation’s ecosystem, alongside popular open-source technologies like Kubernetes. Prometheus is built around providing monitoring for numeric time-series data. It is powerful in terms of being able to provide support for multi-dimensional data collection and querying (using its querying language, PromQL). It sends requests to target points for data collection via HTTP.
Functionalities of Prometheus:
- Time-series data are identified by unique key/value pairs, metric names, and/or tags for easier referencing, and are stored in a multi-dimensional data model.
- PromQL is the query language in the Prometheus ecosystem to leverage the key/value data storage functionality.
- No reliance on distributed storage; single server nodes are autonomous.
- Time-series collection happens via a pull model over HTTP.
- Multiple modes of graphing and dashboarding support.
- Designed for reliability, with each Prometheus server being standalone, not depending on network storage or other remote services.
Drawback:
- Data collection via Prometheus may not guarantee 100% accuracy, and in such a case Prometheus can be used for only monitoring and visualization of data.
Grafana-as-a-service on MetricFire
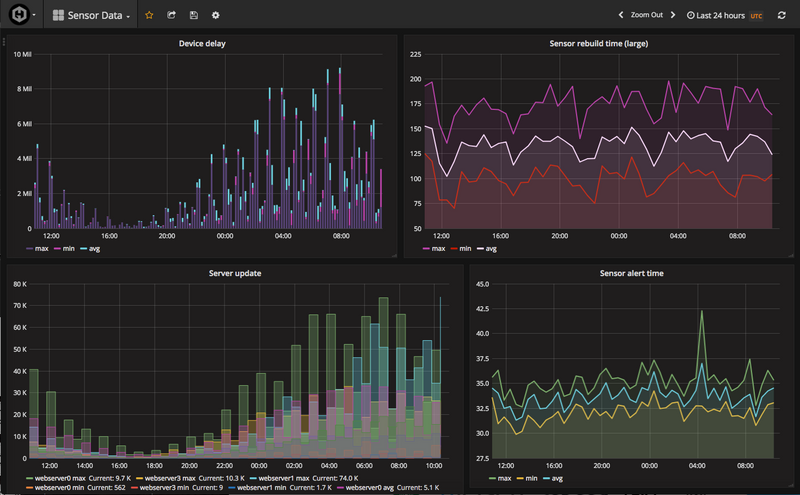
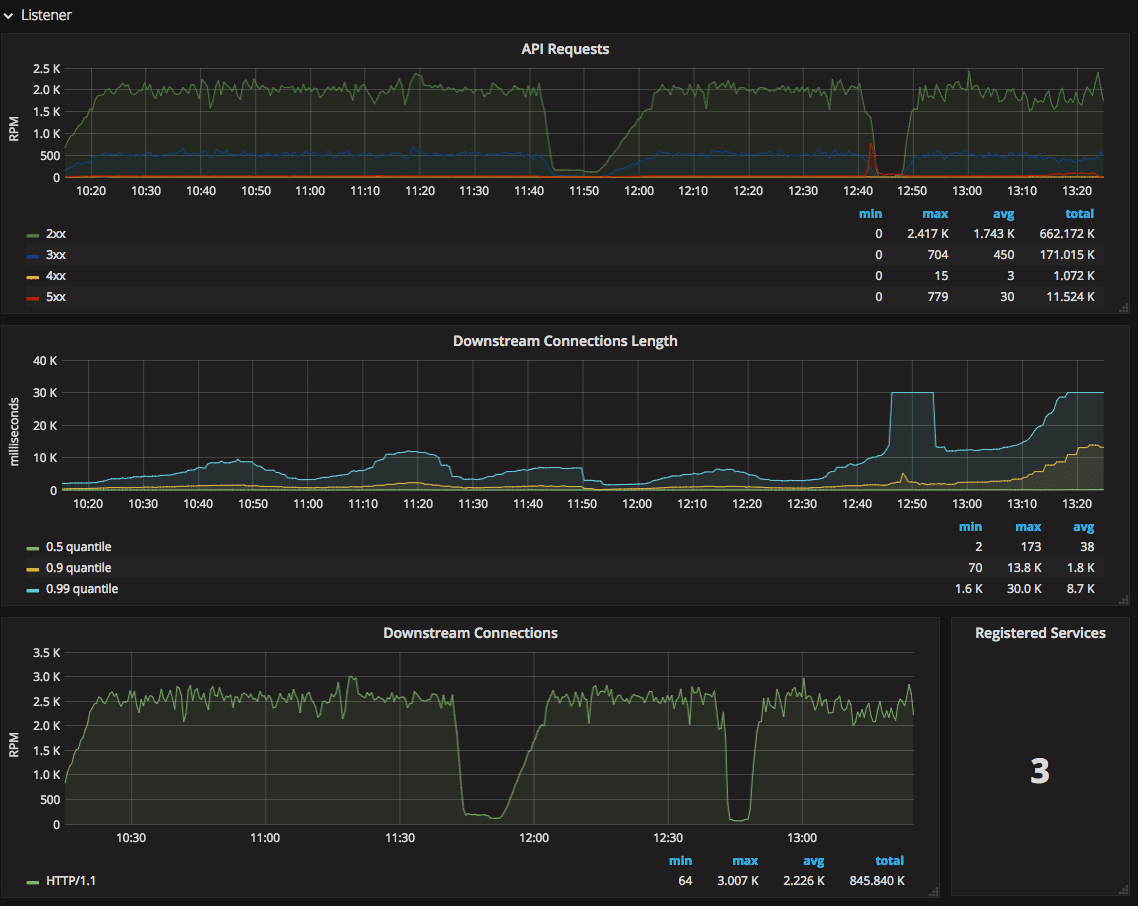
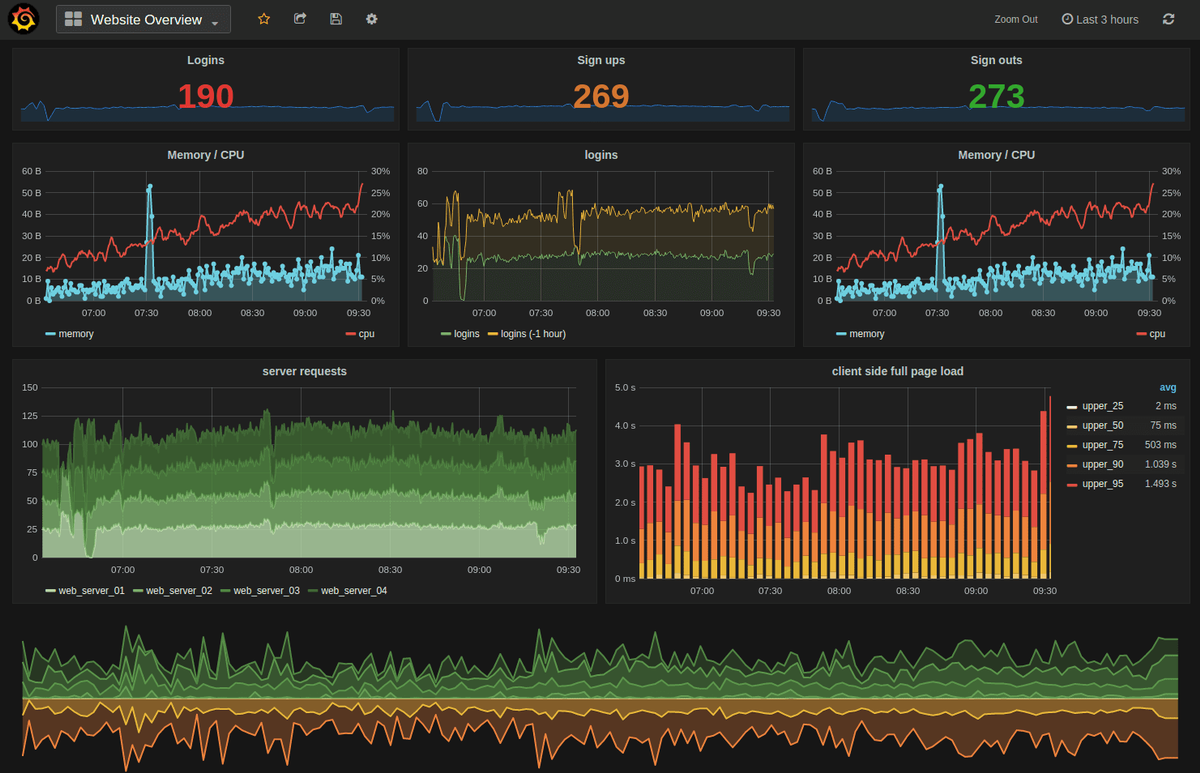
Grafana is a popular open-source platform for monitoring and observability. It is flexible for any kind of database and is known for rendering powerful, informative graphs. Its renderings are visually appealing, trackable and utilitarian, which is why Grafana is so widely used by numerous companies.
Grafana is extremely powerful for creating shareable and comprehensible dashboards across team members and provides state-of-the-art metric analysis and data visualization. It is open-source and free.
Grafana Enterprise uses Graphite and Prometheus backends to make the best of the output received from the Grafana stack.
Functionalities of Grafana:
- Visualization
- Dynamic dashboards
- Explore logs and metrics
- Alerting
- The flexibility of data source selection
- Annotations for highlighting critical points
- Ad-hoc filters to allow you to create new key/value filters on the fly, which are automatically applied to all queries that use that data source
- Easier collaboration among teams due to powerful dashboards
- Prevention of cross-contamination by restricting access to particular data sources
- Can be locally hosted or self-deployed on Grafana Cloud
- Streamline user role and permission management
- API integration
MetricFire provides Hosted Grafana with Hosted Prometheus and Hosted Graphite starting at $99/month. It merges the best parts out of all these services and provides business-ready tools. Grafana is a standard with all MetricFire plans due to its:
- Powerful, intuitive UI
- The abundance of features like highlights, adding rows, and panels, zooming and customizing graphs
- Beautiful, visually informative dashboards
Splunk
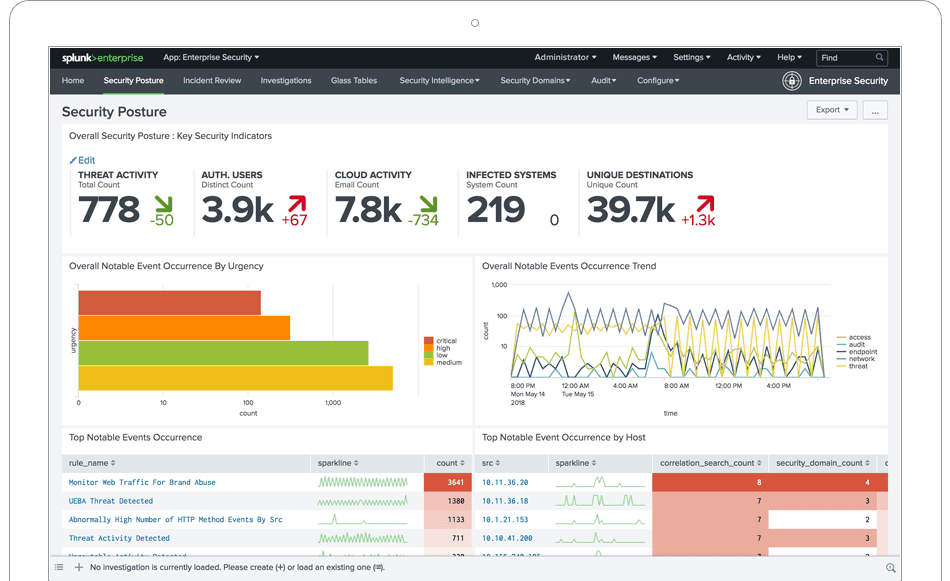
Splunk is a data monitoring service that works excellently with all machine-generated data. Machine data includes transactions, customer behavior, sensor readings, machine behavior, security threats, fraudulent activity, and more.
Splunk is a paid service and can collect data and create powerful dashboards with it.
Functionalities of Splunk:
- Data collection and indexing of machine data in real-time
- Real-time analysis of data being uploaded to the monitoring tool to identify trends, and patterns and spot them immediately
- One platform for data collection, monitoring, visualization, analysis, storage, and querying
- It is easy to deploy and use, and create powerful dashboards
- Scale easily from a single server to multiple data centers
- Secure data handling, role-based access controls, auditability, and data integrity
- Integration with big data analytics solutions for high-volume, dynamic and unstructured data
Splunk data analysis services cost $225/month. Splunk Free is available for 1 user and up to 500 MB of data per month. Splunk also has volume-based pricing and a wide variety of specific products that can be purchased at other prices.
Compared to Graphite:
- It is expensive, price is a setback
- It provides a unified platform for all data-related tasks, without any need for integration with other tools
- It provides real-time data monitoring, metric analysis, trend visualization, and alerts
InfluxDB
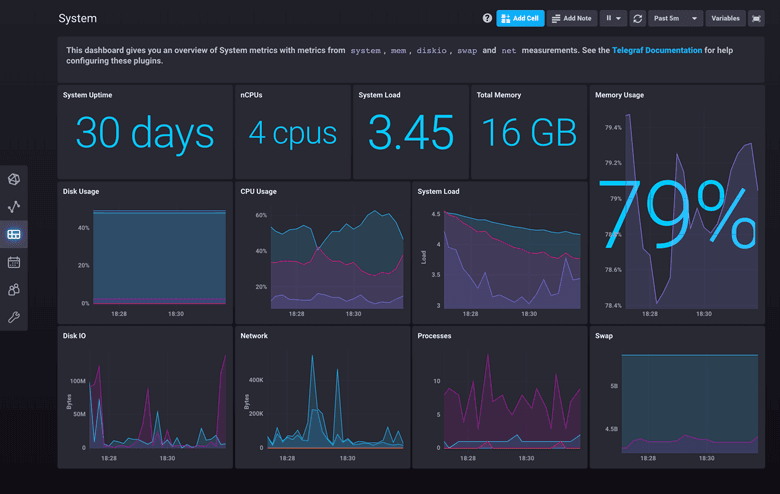
InfluxDB is another new and upcoming open-source, time-series data monitoring software. It is used as a unified platform for metric analysis, IoT monitoring, and analytics. It can monitor and control private and public cloud infrastructures (e.g., PaaS, SaaS, website), application, and database instances, and the entire infrastructure including network servers, routers, and switches.
Functionalities of InfluxDB:
- One unified platform for insights into all infrastructure monitoring
- Real-time monitoring of data
- Alerts
- Automation and Customization
- allows for the definition of custom logic or user-defined functions to process alerts
- Global Distributed Environments
- Continuous Delivery
Compared to Graphite, it:
- Provides real-time analytics, with precision and downsampling
- Has user-defined logic for external plugins and/or data monitoring tools
- Provides continuous delivery functionality
Power BI
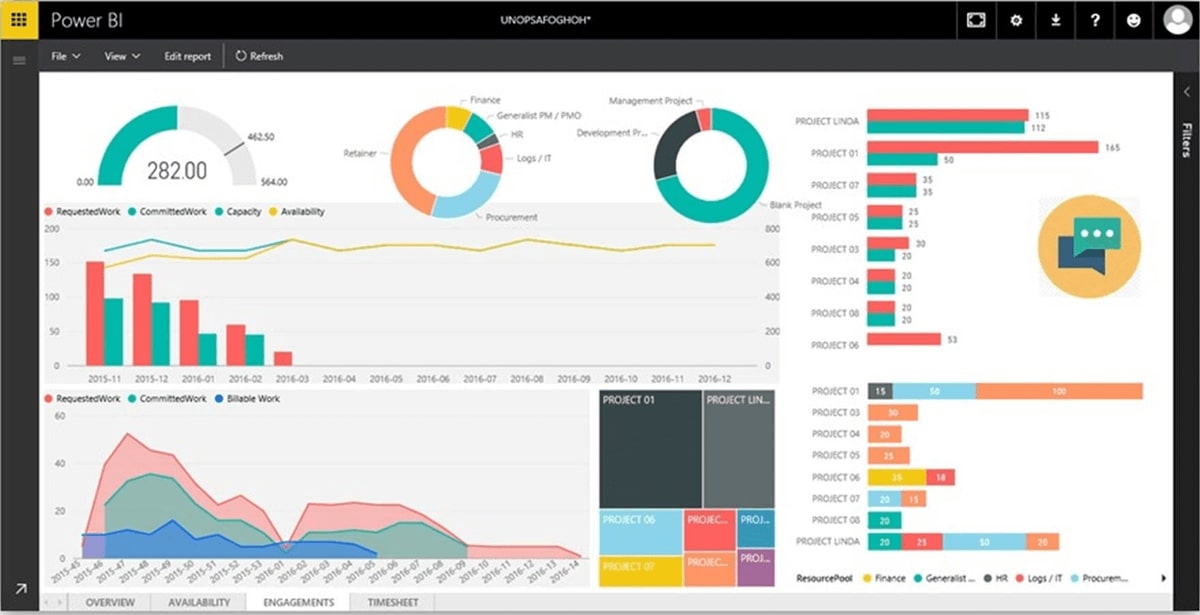
Power BI is a data collection software by Microsoft that is spreading in popularity for business intelligence and monitoring services. It is a collection of software services, apps, and connectors that work together to turn unstructured data into visually immersive and interactive insights.
It is robust; the data can be an Excel spreadsheet or a collection of cloud-based/on-premises hybrid data sets.
Functionalities of Power BI:
- Connecting data sources: A common workflow in Power BI begins by connecting to data sources and building a report
- Power BI Report Server helps create, deploy, and manage Power BI mobile and paginated reports on-premises with a range of ready-to-use tools and services
- Visualizations, powerful dashboard creation
- Alerting on specific events
- Ad-hoc analysis of metrics
- APIs to customize according to customer’s needs and utility
Power BI is a paid service and has two main prices:
- Power BI Pro: $9.99/month per user with an annual subscription
- Power BI Premium: $4,995/month per dedicated cloud compute and storage resource with an annual subscription
Compared to Graphite, it:
- Provides cross-platform utility, which is much more consistent with efficient collaboration and communication in a team
- Is paid
ElasticStack (ELK)
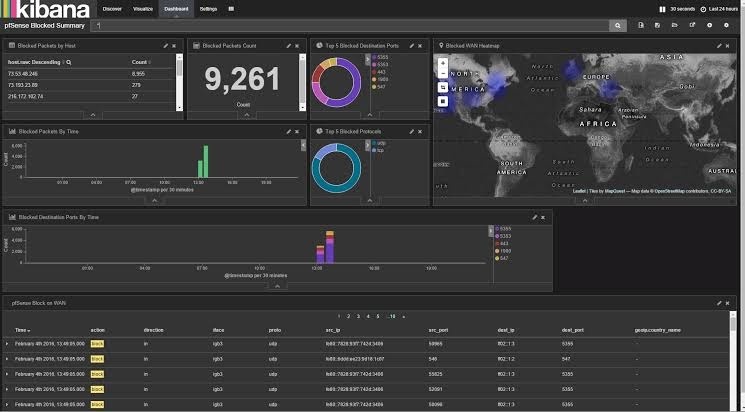
ELK stands for Elasticsearch, Logstash, and Kibana. The company began with Elasticsearch, which is an open-source search engine for raw data from logs, metrics, or web applications. It has a web interface and can be used for searching, logging, monitoring, and analysis. Kibana is the open-source dashboard for visualizing Elasticsearch. Kibana is the interface through which users see their Elastic Stack, and provides features such as data exploration, collaboration, and forecasting on data trends. Different types of data can be processed by Elasticsearch through Logstash which acts as a data pipeline, converting the data to an Elasticsearch-friendly format.
Elasticsearch has a hosted version available through the open-source project’s website.
Functionalities of Elastic Stack:
- Securely take data from any source, in any format, then search, analyze, and visualize it in real-time
- Powerful visualizations
- Collaborative dashboards that can be embedded
- Alerting
- Cloud deployment
- Data snapshot and restore
- Clustering and high availability: in case a node goes down, a replica can take its place
Compared to Graphite:
- It provides data collection and analysis in real-time
- It is great for data searching.
- It provides forecasting for data.
- It is the best software to use if you are already using one part of the ELK stack, making it easy to expand to using the others.
Conclusion
After evaluating all the findings on the best data monitoring services that are being used by organizations today, we can say that Graphite and InfluxDB are the favorites. This is because they are free, open-source, provide customization, and integrate with outside tools. Grafana is open-source and is unmatched when it comes to rendering the most detailed and interactive graphical visualizations of the metrics.
For users who are not able to manage open-source projects on their own, MetricFire is the best solution as it hosts the open-source projects on behalf of the customer. MetricFire has no lock-in for data, allowing customers to fall back on their own Graphite or Grafana installations at any time. If you're interested in MetricFire, sign up for our free trial or get us on the phone by booking a demo.
This post is a guest post by our bloggers Vipul Gupta and the Mixster team. Check out their site for more tech news!


