Table of Contents
Introduction
Server monitoring is crucial to learn these days to use your servers efficiently. It helps optimize the performance of a server and diagnose issues productively. One useful tool used these days is Graphite, which helps monitor a server’s performance and provides graphing solutions by gaining valuable insights into your server.
You can explore MetricFire’s Hosted Graphite service today by signing up for a free trial or booking a demo session.
Key Takeaways
-
-
Server monitoring helps maintain smooth operations and reduces downtime.
-
Graphite helps visualize and analyze server performance data.
-
Monitoring with Graphite enables data-driven decision-making and proactive issue resolution.
-
To monitor your server with Graphite, you need to configure your data source, Carbon, and your Whisper backend.
-
What is server monitoring?
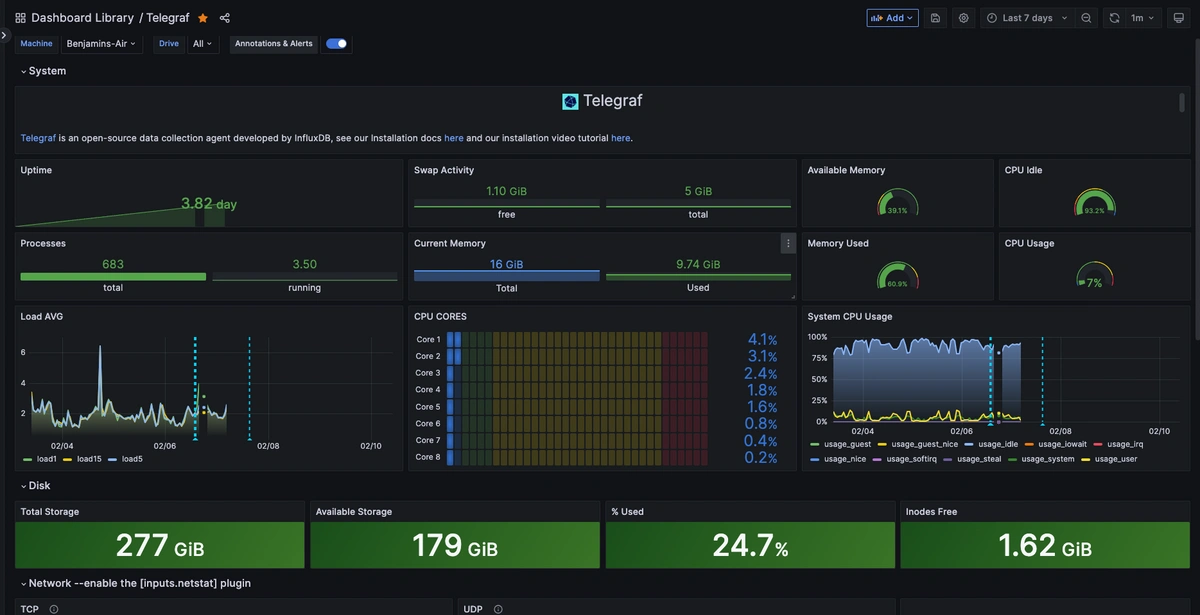
Server monitoring helps you understand what is happening in your servers. The main goal of server monitoring is to ensure that servers work efficiently and securely to support the functioning of various applications and services. It involves continuously gathering and analyzing data from the server’s hardware, software, or network. As servers are critical to any organization’s infrastructure, monitoring them correctly ensures that data is secure. These servers can be physical or virtual. Some of the most common metrics include:
-
CPU Usage: Monitoring the Central Processing Unit (CPU) helps gauge the server’s load and identify performance bottlenecks.
-
Memory: Continuously checking memory usage on a server ensures that the server does not slow down or crash due to space unavailability.
-
Disk: Detecting storage capacity issues, performance bottlenecks, and potential failures, ensuring system stability.
-
Network Traffic: Tracking incoming and outgoing traffic on a server helps detect anomalies and ensures that the network bandwidth is sufficient for data transfers.
-
Response time: Assessing response time to requests ensures a smooth user experience and application responsiveness.
-
Server updates: It is crucial to ensure the server is reliable; server uptime and downtime are kept in check for this purpose.
-
Error rates: Keeping error codes such as HTTP or application error codes in check provides insights into system stability or performance issues.
-
Security: Server Monitoring is crucial to ensure that unwanted security breaches are not made and only authorized users can access the content.
- Resource Utilization: Tracking how server resources are used can help optimize resource allocation and prevent server overload.
Why should you monitor servers?
Servers are the backbone of any business. If they fail, your entire system will be helpless. If you realize your server’s performance is decreasing, you can take the necessary precautionary measures to improve it. Thus, it is essential to implement monitoring to check your server’s health, capacity, and performance.
Server monitoring involves the continuous collection of real-time data from various servers. This data includes CPU usage, memory consumption, disk performance, and network traffic metrics. Overall, these metrics give insights into server performance and whether it is within its acceptable limits. By analyzing this collected data, you gain a comprehensive understanding of the patterns, trends, and anomalies in the data. This allows you to prevent potential bottlenecks. For example, spikes in CPU usage at a particular time indicate a higher user activity with excessive memory utilization, which can point to a leak in the application. Early detection through server monitoring can help prevent this.
The primary goal of server monitoring is not to let problems escalate to the point where they become critical. Therefore, proactive intervention prevents major catastrophes. Administrators can receive notifications when specified metrics cross a certain threshold by setting up alerts. Monitoring tools can also store historical data to identify long-term trends. This approach helps in capacity planning and infrastructure upgrades.
Effective server monitoring can also help optimize resource allocation. For example, administrators can allocate resources to work correctly if a server is below capacity. Server monitoring also helps with security. Security metrics can help gain insights into firewall breaches, unauthorized login attempts, and other security threats. Effective server monitoring can curtail these threats.
Many monitoring tools also support visualization features such as graphs, charts, and dynamic dashboards. These visualizations help the admin check the server’s health and performance at a glance. Overall, server monitoring helps with data-driven decisions, capacity planning, smooth user experience, security breaches, proactive maintenance, and resource allocation.
You can join MetricFire’s free trial or book a demo session to learn more about server monitoring.
How to monitor your servers with Graphite
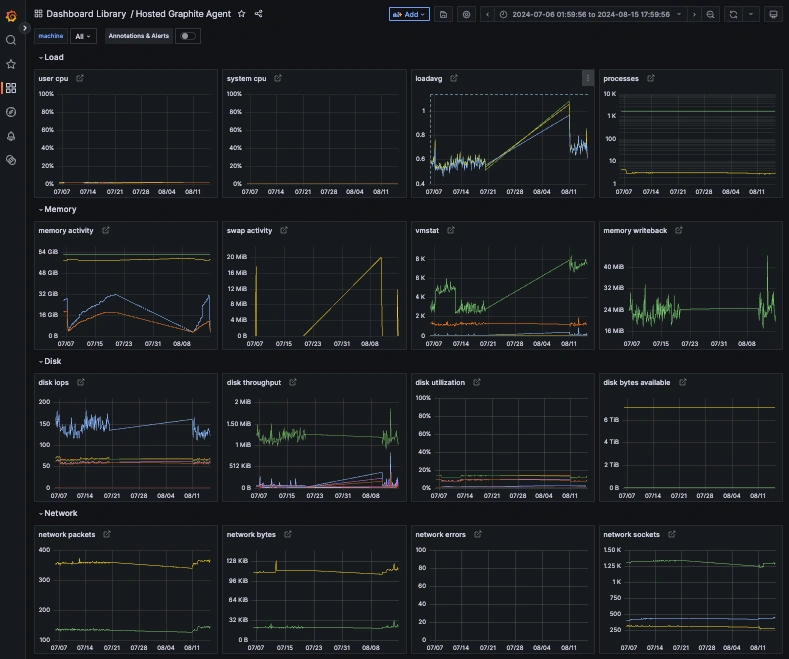
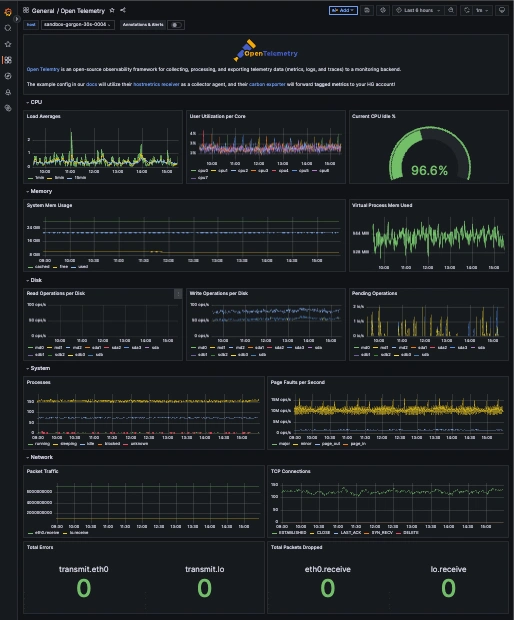
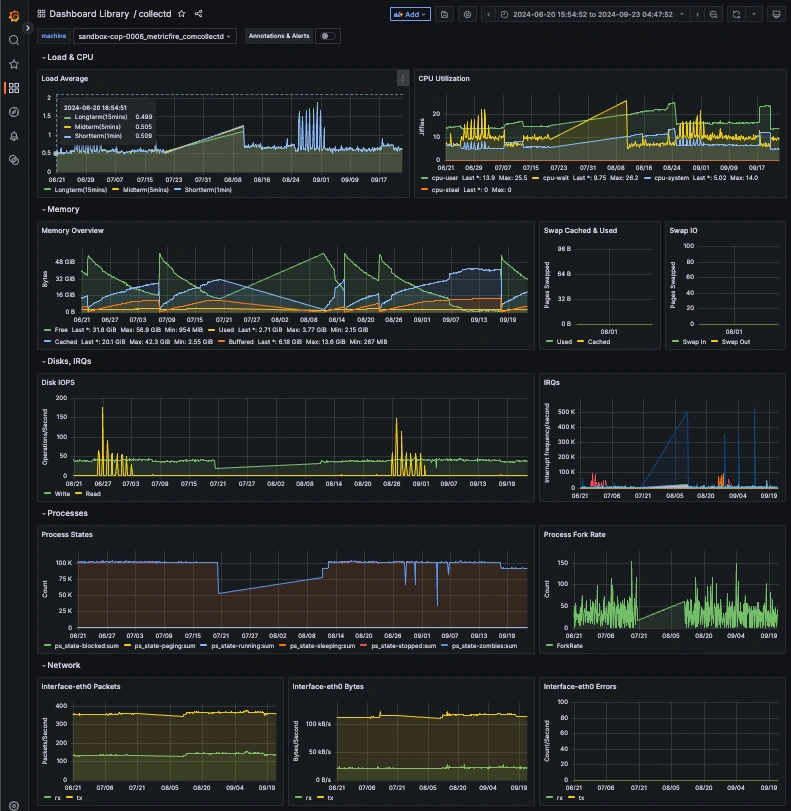
Graphite is an open-source graphing system for time-series data. It features a storage backend (Whisper), a query language with built-in functions for data manipulation, and a basic web interface for visualizations. Metrics sent to Graphite's carbon endpoint are timestamped, stored, and can be graphed, and it is a well-documented and user-friendly tool for monitoring and analyzing time-series data.
Server monitoring with Graphite involves several key steps to set up and configure the monitoring system. You can begin by installing Graphite on your system and can read this guide to help install and set up Graphite components. After installing Graphite and its components on your device, you can proceed to the following steps to monitor your servers with Graphite.
1. You need to configure your data collection. First, you must determine which metrics to monitor, such as CPU usage, memory utilization, resource allocation, network traffic, etc. Then, modify your Carbon configuration to specify which metrics to collect and how often to collect them. Finally, you can choose data aggregation methods, such as average, sum, etc., to consolidate your data points.
2. Next, you must configure a Whisper backend and define retention policies to determine how long data points will be retained.
3. You can use Graphite-Web’s interface to create graphs, dashboards, and different visualizations from the collected data. You can also experiment with various colors and time ranges.
4. You can regularly monitor and analyze server data to identify trends or anomalies.
5. Historical data can also be used to plan resource scaling, capacity upgrades, and infrastructure optimization.
6. If you use open-source Graphite, you can integrate with a dashboarding tool like Grafana, for enhanced visualizations and alerting features. You can also use Hosted Graphite, where you get a hosted data source, fully customizable Grafana dashboards, and 24/7 support from Graphite experts.
Conclusion
Server monitoring helps safeguard against server downtime and aids data-driven decisions. It is an important part of understanding your infrastructure and ensuring things are running smoothly for your business.
Graphite, an open-source system for server monitoring, collects, stores, and visualizes time series data. Hosted Graphite allows you to easily implement monitoring with an expert team ready to help you. By using the steps outlined in this article, you can easily configure your monitoring with Graphite. Our team is happy to talk all things Graphite, so even if you aren’t a customer, try booking a call!
You can look at more Graphite articles at MetricFire and book a free trial or a demo session to get more insights into our Hosted Graphite version.