Table of Contents
Introduction
Our latest project at MetricFire is a brand-new CLI tool! This tool makes agent installation on any OS a breeze, and we are quite proud of it.
In this article, we’ll share an overview of HG-CLI, and how to use it in Terminal User Interface (TUI) and Command Line Interface (CLI) mode. We’ll also show you what to do with the metrics that are collected and forwarded to your Hosted Graphite account, giving you a full server monitoring setup in minutes! If you don't already have a Hosed Graphite account with MetricFire, sign up for a free 14 day trial HERE.
Use the HG-CLI Tool to Easily Install and Configure an Agent
We wanted to make onboarding as smooth as possible for users who’ve never installed an agent before. With HG-CLI, our goal at MetricFire was to provide a quick and easy way to install an agent, start collecting meaningful metrics, and see the data in a dashboard within minutes. This takes away the burden of self-hosting your own monitoring solution, allowing you more time and freedom to work on your most important tasks!
While installing an agent isn’t too difficult, it does involve multiple steps and working with configuration files. Often these configs are yaml files which are very picky about things like indentation and whitespace, so editing these can sometimes lead to frustrations. Users need dig through settings, search for the right options, and manually format the file. To simplify this, we set out to build a one-step solution that handles the heavy lifting for the monitoring and observability community - built on open-source technologies of course!
Here are the steps to configure and install an agent using the HG-CLI tool:
- Install the HG-CLI tool on any OS:
curl -s "https://www.hostedgraphite.com/scripts/hg-cli/installer/" | sudo sh
- Run it in TUI mode:
hg-cli tui
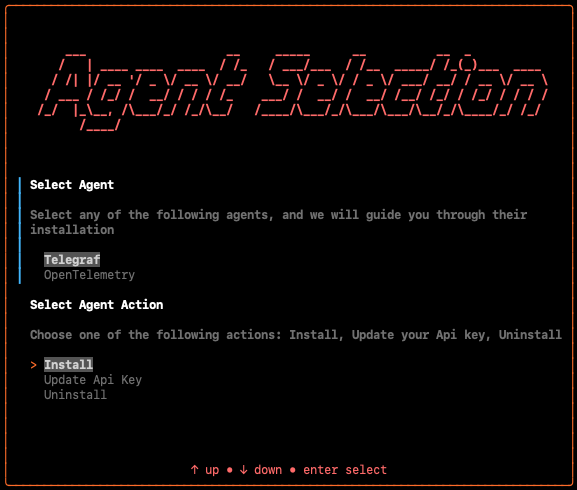
- Select 'Agents', select an Agent, and select 'Install':
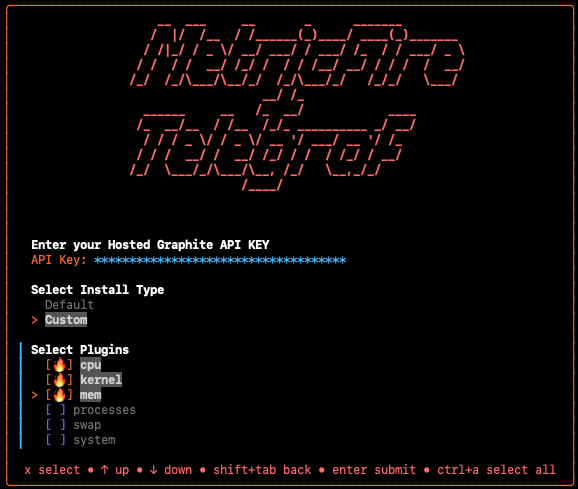
- Add your Hosted Graphite API Key and select a 'default' or 'custom' configuration (if a custom install, select the metric types using the X key):
- Hit enter to execute the installation/configuration. Note the output which will display:
- the location of the config file on your machine
- the command to start the agent on your machine
- Start the agent and metrics will be collected and forwarded to your Hosted Graphite account.
- e.g: brew services start telegraf or sudo systemctl start telegraf
Create Custom Dashboards and Alerts
You can use your new agent metrics to create unlimited visualizations and alerts - this is the fun part!
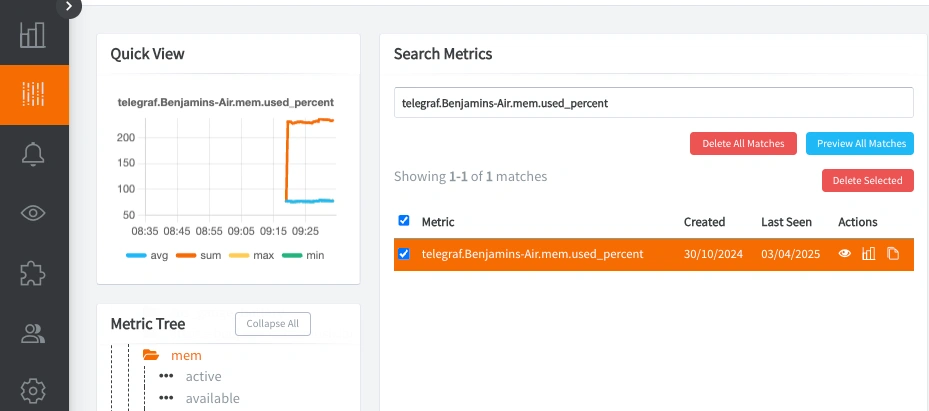
- Login to your HG account to see the agent metrics in the Metrics Search UI (prefixed with telegraf.*):
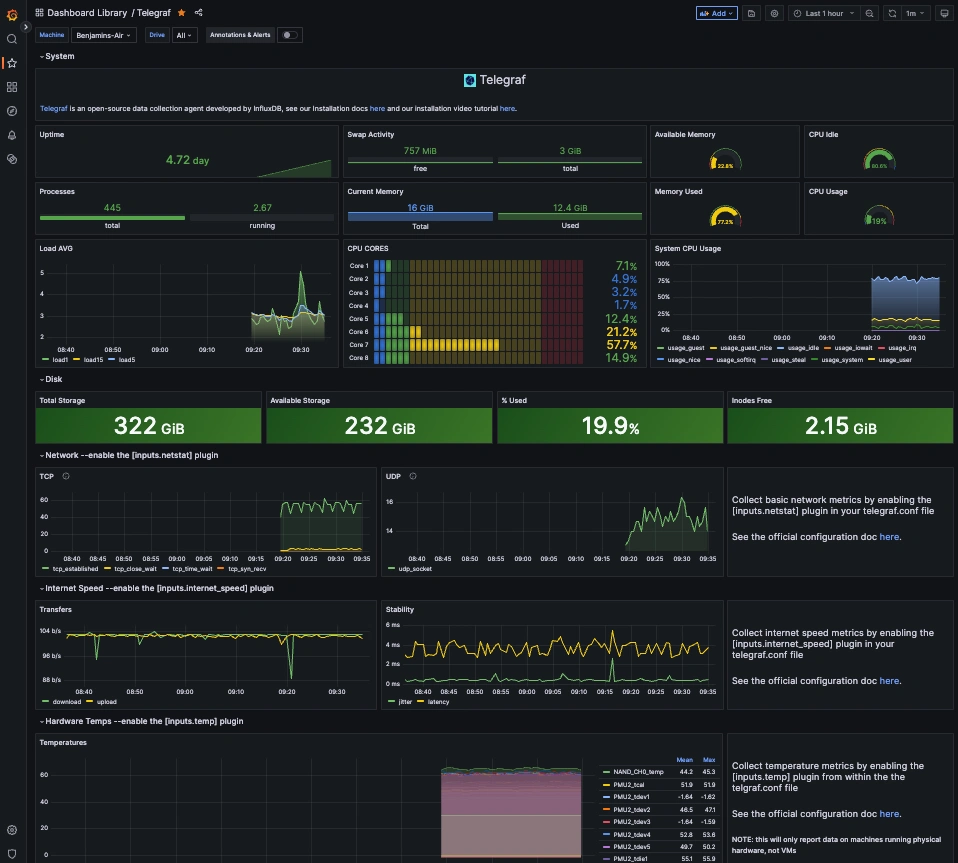
- Go to Dashboards => Telegraf to see your metrics appear in an automatically generated dashboard!
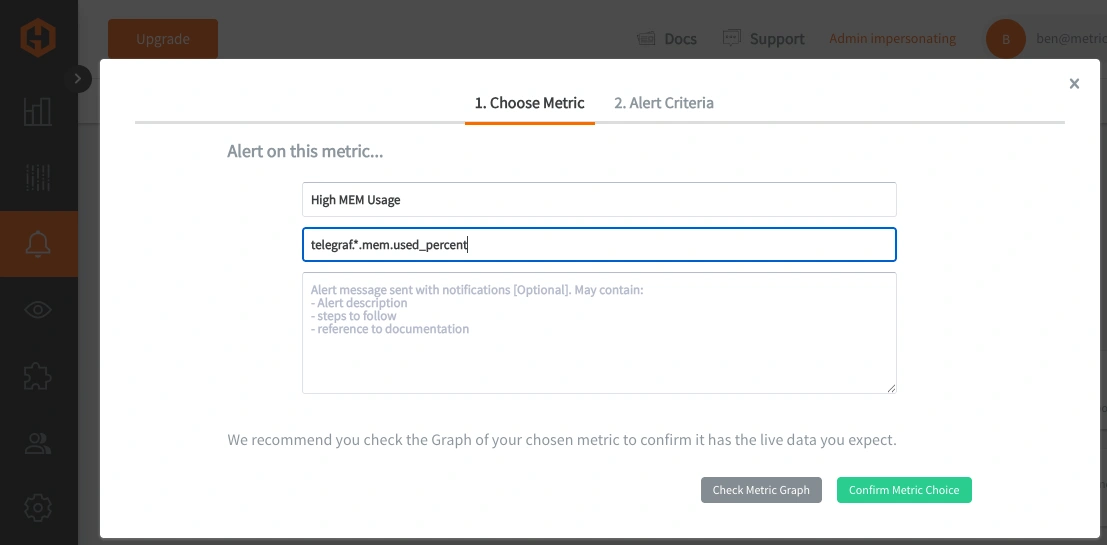
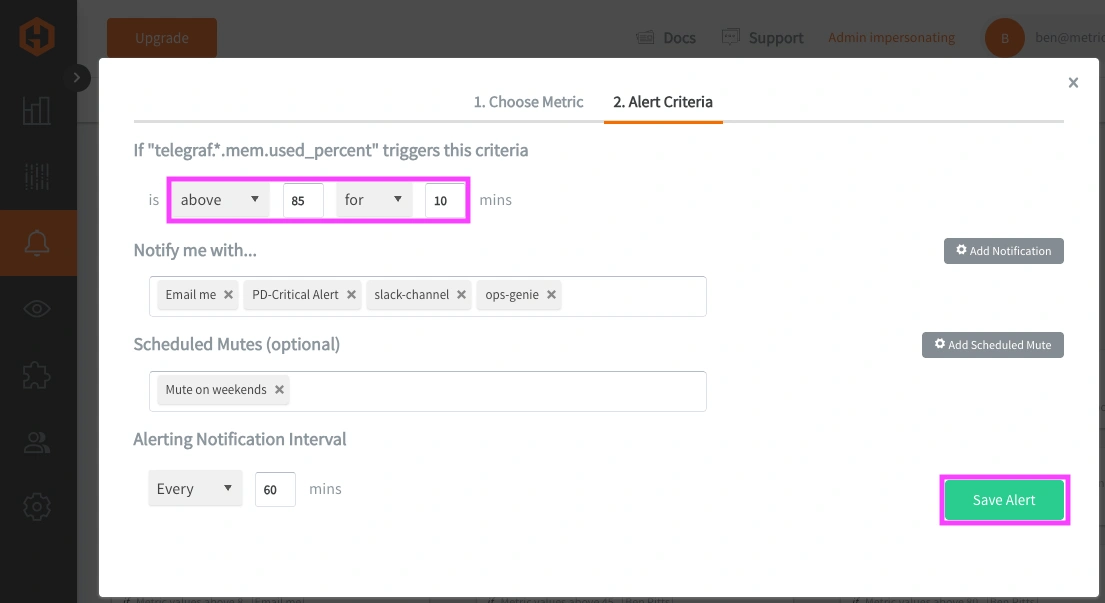
- Go to Alerts => Graphite Alerts and add a new alert for any of your metrics:
- See our documentation and learn how to monitor the other layers of your infrastructure.
- Sit back and relax. You've just configured an end-to-end monitoring environment and you are the team's newest DevOps champion!
Additional HG-CLI Commands
You can run the HG-CLI tool in CLI mode to programmatically install agents (with default/custom plugins), update API keys, and fine-tune your config with just a few flags. While the tool is still evolving, it’s already proving an easy way to quickly get an agent running in your server fleet.
- To install Telegraf using CLI mode with the default setup:
hg-cli agent install telegraf --apikey <HG-API-KEY> --install default
- For a custom install, specify the plugins you want:
hg-cli agent install telegraf --apikey <HG-API-KEY> --install custom --plugins cpu,disk,mem,system
- To update an API key in an existing Telegraf config:
hg-cli agent update-apikey telegraf --apikey <HG-API-KEY> --config <config path>
- To uninstall an agent:
hg-cli agent uninstall telegraf
Follow us on LinkedIn and X to get the latest updates and plugins!
Our Goals and Upcoming Features
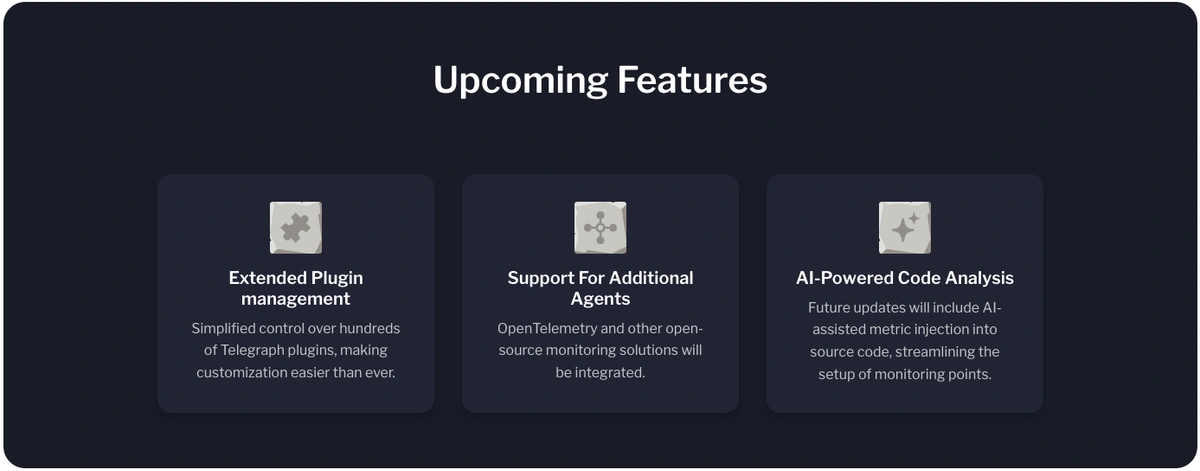
We're building additional agents into the tool (OpenTelemetry) to give users more monitoring options. We will also implement a feature to configure popular Telegraf input plugins such as NGINX, MySQL, PostgreSQL, GitHub, Docker, and more!
We also plan to add integrations with our Hosted Graphite APIs in the future to create annotations, alerts, aggregation rules, and more! This will be helpful for first-time users learning the platform's ins and outs, and for users who want to use it in their daily monitoring workflow.
Conclusion
At MetricFire, we’re committed to making infrastructure monitoring as seamless and accessible as possible. Our new CLI tool is designed to simplify the installation process so you can get up and running with powerful monitoring in seconds with no hassle, and no guesswork. We’re excited to see how it empowers developers to stay focused on building great products. If you’re interested in joining the beta or have feedback to share, we’d love to hear from you - let’s build something great together.
What are your thoughts on the HG-CLI tool? If you have a feature request or suggestion, contact our team! We love exploring possibilities to provide the best monitoring solution for your needs.


