
Table of Contents
Great systems are not just built. They are monitored.
MetricFire runs Graphite and Grafana as a fully managed service for growing engineering teams, taking care of storage, scaling, and version updates so your team doesn't have to. Plans start at $19/month, billed per metric namespace rather than per host, and include engineer-staffed support. Integrations work natively with Heroku, AWS, Azure, and GCP, and data is stored with 3× redundancy in SOC2- and ISO:27001-certified data centres.
Introduction
RavenDB is a NoSQL document database that stores data in the form of JSON documents, offering high availability, scalability, and ACID transactions to manage large volumes of unstructured data efficiently. It is commonly used for real-time web applications, distributed systems, and cloud services due to its performance and ability to handle complex queries and indexing. Monitoring the performance of RavenDB is crucial to ensure optimal system operation, quickly identify and resolve issues such as slow queries or resource bottlenecks, and maintain the overall health and reliability of the application infrastructure.
In this article, we'll detail how to use the Telegraf agent to collect RavenDB performance statistics and forward them to a data source.
Getting Started with the Telegraf Agent
Telegraf is a plugin-driven server agent built on InfluxDB that collects and sends metrics/events from databases, systems, processes, devices, and applications. It is written in Go, compiles into a single binary with no external dependencies, and requires a minimal memory footprint. Telegraf is compatible with many operating systems and has many helpful output plugins and input plugins for collecting and forwarding a wide variety of system performance metrics.
Install Telegraf (Linux/Redhat)
/etc/telegraf/wget https://dl.influxdata.com/telegraf/releases/telegraf_1.30.0-1_amd64.deb
sudo dpkg -i telegraf_1.30.0-1_amd64.deb
RedHat/CentOS
wget https://dl.influxdata.com/telegraf/releases/telegraf-1.30.0-1.x86_64.rpm
sudo yum localinstall telegraf-1.30.0-1.x86_64.rpm
Configure an Output
You can configure Telegraf to output to various sources, such as Kafka, Graphite, InfluxDB, Prometheus, SQL, NoSQL, and more.
In this example, we will configure telegraf with a Graphite output. If you're not currently hosting your data source, start a 14-day free trial with Hosted Graphite by MetricFire to follow these next steps.
A Hosted Graphite account will provide the data source, offer an alerting feature, and include Hosted Grafana as a visualization tool.
To configure the Graphite output, locate the downloaded telegraf configuration file at /etc/telegraf/telegraf.conf and open it in your preferred text editor. Then, you will need to make the following changes to the file:
First, uncomment the line:
[[outputs.graphite]]
Next, uncomment and edit the server line to:
servers = ["carbon.hostedgraphite.com:2003"]
Finally, uncomment and edit the prefix line to:
prefix = "<YOUR_API_KEY>.telegraf"
Configure Your RavenDB Instance
This article assumes that you already have an instance of RavenDBr running, but here's a quick install guide (ubuntu) if you want to configure one for testing purposes:
- Dependencies:
- sudo apt-get install curl apt-transport-https -y
- Install:
- sudo curl -O https://daily-builds.s3.us-east-1.amazonaws.com/RavenDB-5.4.110-linux-x64.tar.bz2
- sudo tar -xvjf RavenDB-5.4.110-linux-x64.tar.bz2 -C /opt/
- Configure the /etc/systemd/system/ravendb.service file:
- NOTE: you must configure this to a port that's not already in use and for this example I'm using port 42983 - here's a simple python command that can locate an available port:
- python3 -c "import socket; s = socket.socket(socket.AF_INET, socket.SOCK_STREAM); s.bind(('', 0)); print(s.getsockname()[1]); s.close()"
-
[Unit]
Description=RavenDB Server
After=network.target

[Service]
Type=simple
ExecStart=/opt/RavenDB/Server/Raven.Server --ServerUrl=http://0.0.0.0:42983 --Security.UnsecuredAccessAllowed=PublicNetwork
WorkingDirectory=/opt/RavenDB
Restart=on-failure
User=www-data

[Install]
WantedBy=multi-user.target
- NOTE: you must configure this to a port that's not already in use and for this example I'm using port 42983 - here's a simple python command that can locate an available port:
- Configure the /opt/RavenDB/Server/settings.json file (must use a TCP port thats not already in use):
-
{
 "DataDir": "RavenData",
 "Monitoring.Enabled": true,
 "License.Eula.Accepted": true,
 "Setup.Mode": "Unsecured",
 "Security.UnsecuredAccessAllowed": "PublicNetwork",
 "ServerUrl": "http://0.0.0.0:42983",
 "ServerUrl.Tcp": "tcp://0.0.0.0:59913"
}
-
- Enable and start the service:
- sudo systemctl daemon-reload
- sudo service ravendb restart
- sudo service ravendb status
- In order to use the metric collection endpoint, you must apply for and configure a RavenDB Developer License, which you can do HERE.
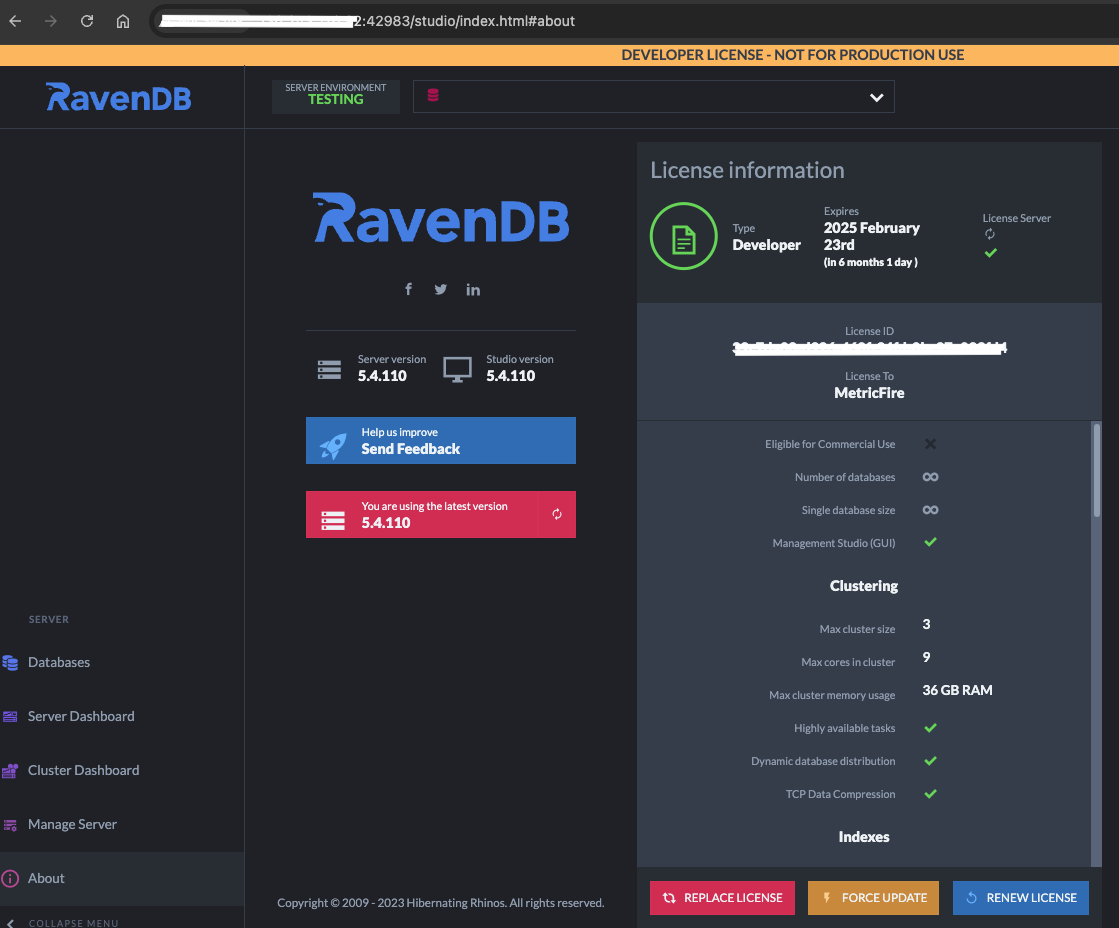
- Once the license key is sent to your email, you can serve your RavenDB instance in your browser, and add the license key via the browser interface:
- in your Linux server, allow for external connections: sudo ufw allow 42983/tcp
- in your browser, navigate to: http://<your-server-IP>:42983
- in the RavenDB Studio interface, configure the connection to your server, then add your Developer License key
- You can test that the monitoring endpoint is working with the following curl command:
- curl http://localhost:42983/admin/monitoring/v1/server
Configure the Telegraf Plugin
Telegraf has many input plugins that can collect a wide range of data from many popular technologies and 3rd party sources. In this example, we'll demonstrate how to collect and forward metrics from your RavenDB instance.
First, you will need to search for the inputs.ravendb section in your telegraf.conf file, uncomment the [[inputs.ravendb]] line:
[[inputs.ravendb]]
Then just uncomment and configure the 'url' line:
url = "http://localhost:42983"
Finally, you can save your changes and run the telegraf daemon using the following command. This will help you see if there are any configuration errors in the output:
telegraf --config telegraf.conf
Once your RavenDB instance is in use (insert/update/delete documents and indexes), Telegraf will collect and forward roughly 90 metrics per DB to your configured datasource.
See the official GitHub repository for additional details and configuration options for the RavenDB plugin.
Use Hosted Graphite by MetricFire to Create Custom Dashboards and Alerts
MetricFire is a monitoring platform that enables you to gather, visualize and analyze metrics and data from servers, databases, networks, processes, devices, and applications. Using MetricFire, you can effortlessly identify problems and optimize resources within your infrastructure. Hosted Graphite by MetricFire removes the burden of self-hosting your monitoring solution, allowing you more time and freedom to work on your most important tasks.
Once you have signed up for a Hosted Graphite account and used the above steps to configure your server(s) with the Telegraf Agent, metrics will be forwarded, timestamped, and aggregated into the Hosted Graphite backend.
-
Metrics will be sent and stored in the Graphite format of: metric.name.path <numeric-value> <unix-timestamp>
-
The dot notation format provides a tree-like data structure, making it efficient to query
-
Metrics are stored in your Hosted Graphite account for two years, and you can use them to create custom Alerts and Grafana dashboards.
Build Dashboards in Hosted Graphite's Hosted Grafana
In the Hosted Graphite UI, navigate to Dashboards and select + New Dashboard to create a new visualization.
Then go into Edit mode and use the Query UI to select a graphite metric path (the default data source will be the HostedGraphite backend if you are accessing Grafana via your HG account).
The HG datasource also supports wildcard (*) searching to grab all metrics that match a specified path.
Now you can apply Graphite functions to these metrics like aliasByNode() to format the name, and exclude() to omit a pattern:
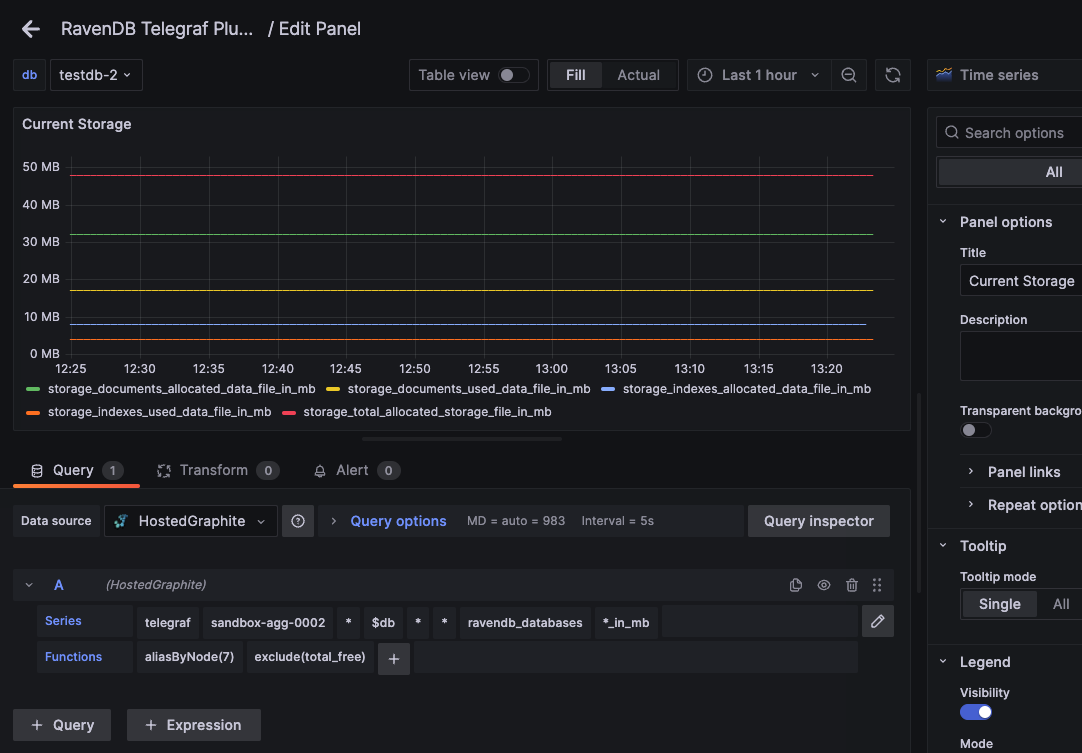
Grafana has many additional options to apply different visualizations, modify the display, set units of measurement, and some more advanced features like configuring dashboard variables and event annotations.
The above example has a dashboard variable configured for 'instance' at index 4 of the metric series. See the Hosted Graphite dashboard docs for more details.
Creating Graphite Alerts
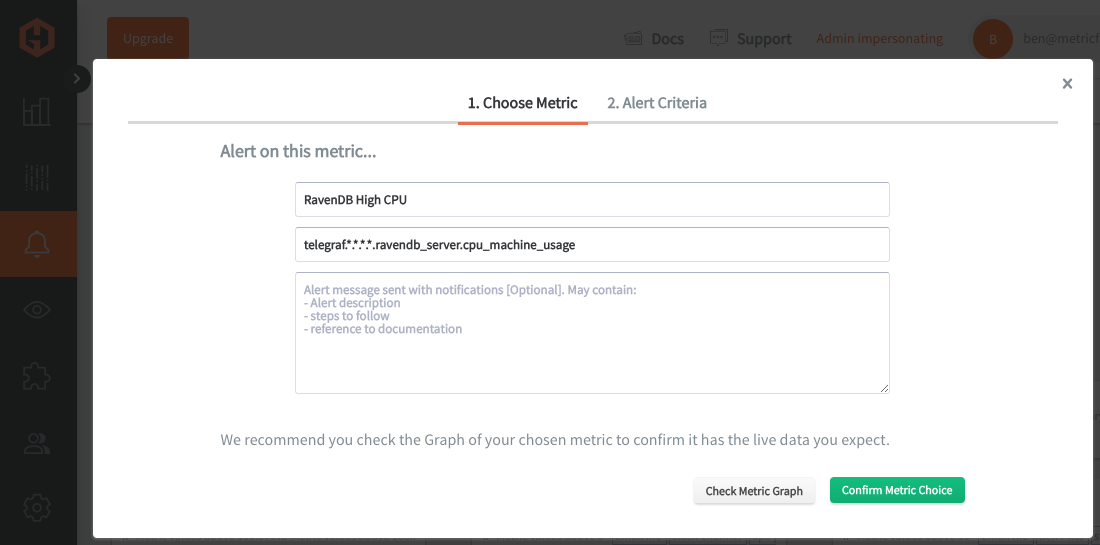
In the Hosted Graphite UI, navigate to Alerts => Graphite Alerts to create a new alert. Name the alert, add a query to the alerting metric field, and add a description of what this alert is:
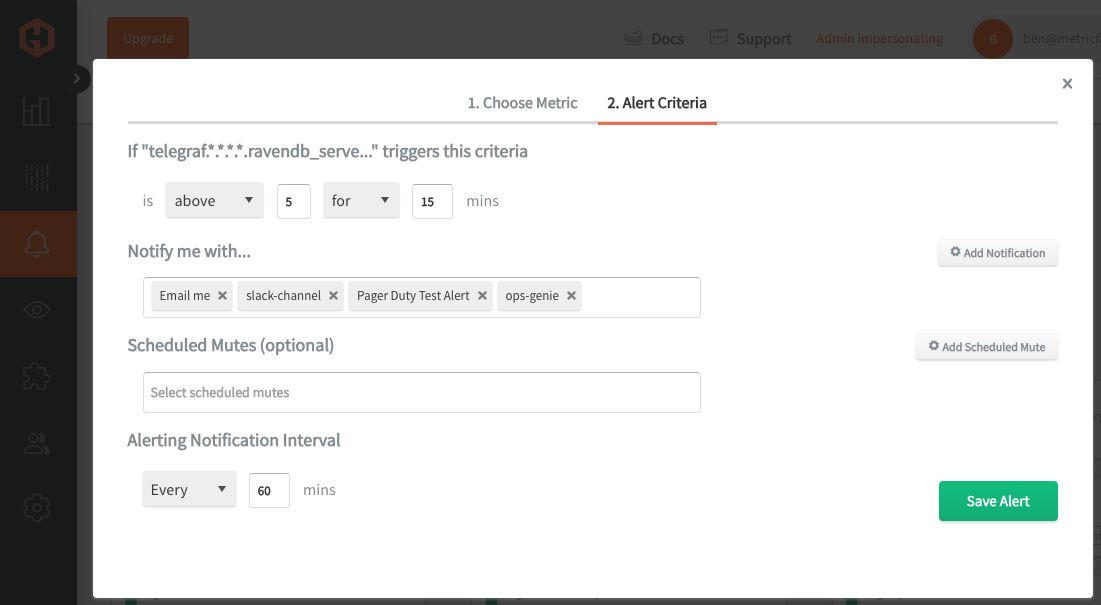
Then, select the Alert Criteria tab to set a threshold and select a notification channel. The default notification channel will be the email you used to sign up for the Hosted Graphite account. Still, you can easily configure channels for Slack, PagerDuty, Microsoft Teams, OpsGenie, custom webhooks and more. See the Hosted Graphite docs for more details on notification channels:
Conclusion
Database monitoring is crucial for ensuring data integrity, optimal performance, and system reliability, which directly impacts customer satisfaction and business operations. It helps detect and resolve issues like slow queries, resource bottlenecks, or security threats before they escalate into significant problems, minimizing downtime and maintaining the continuity of business services.
Tools like dashboards and alerts will complement your data by providing real-time visualization, proactive identification of issues, historical trend analysis, and facilitating informed decision-making, all essential for maintaining a robust and efficient infrastructure.
Sign up for the free trial and begin monitoring your infrastructure today. You can also book a demo and talk to the MetricFire team directly about your monitoring needs.

