Table of Contents
Introduction
Before exploring open-source dashboard tools, we first need to learn about Dashboards and how they can be helpful.
A dashboard is a data visualization and management tool that visually tracks and analyzes the Key Performance Indicators (KPIs), business analytics metrics, infrastructure health and status, and data points for an organization, team, or process. It can be used to present operational and analytical business data with interactive data visualizations to your team.
Dashboards can aid senior leaders, executives, and engineers in establishing targets, analysing progress, monitoring their infrastructure, and implementing appropriate changes. Infrastructure monitoring with dashboards is critical to identifying and recording important metrics for systems in use. Be it physical, virtual, or cloud, it also helps plan for the upgrade of outdated systems with minimum downtime or inconvenience to users and customers.
Now that we know more about dashboards, it's time to see what features to look for in one. You can also book a demo and talk to us directly about what MetricFire can do for you.
Key Takeaways
- Dashboards are data visualization and management tools that track and analyze Key Performance Indicators (KPIs), business metrics, infrastructure status, and data points for organizations and teams.
- When selecting a dashboard tool, consider factors like ease of use, customization, scalability, integration capabilities, extendability, modularity, security management, and data export options.
- The choice of a data monitoring service, like Graphite or Prometheus, can significantly impact the effectiveness of your dashboard tools.
- A hosted service like MetricFire can simplify installing and maintaining open-source dashboard tools, reducing maintenance headaches.
- Each dashboard tool has pros and cons; the choice should depend on the user's or organization's specific needs and preferences.
Finding the perfect Dashboard
Ease of Use
A dashboard tool should be easy to use and learn. It should have a simple interface for creating and managing dashboards that don’t require understanding code. Dashboards should also be pretty self-explanatory so that anyone who uses them can understand where to find the data they are looking for.
Customization
Different users might need other sizes, arrangements, and types of tools on their dashboards. A dashboard tool must be easily customized to fit the user's requirements. The best dashboards are flexible, so you can customize and adjust them to get the results any and every team is working to achieve.
Scalability
Every project and organization experiences growth over time. It is inefficient to keep changing the required tools after each growth phase. A good tool needs to scale to match the project's development and should provide tools that can accommodate the growth.
Integration
A good tool must be integrated with other tools and databases available. Many tools work well, but some dashboards integrate and pull data from other tools so you don't have to manually enter new data into the tool.
Extendable
The tool should be extendable to incorporate new project requirements. Extendability is created by allowing for plugins.
Modularity
Modularity allows different dashboard parts to function independently, making the dashboard more efficient and easier to use. Compact modules help improve the overall aesthetics of the dashboard - making it look cleaner and less cluttered.
Security Management
If a user uses the dashboard to handle sensitive and private data, the tool should provide enough security measures to ensure the data's security.
Exporting Options
Not all dashboard tools provide users with the ability to export their data. Users who prefer to export their dashboard data to use it elsewhere should look for tools that allow data exporting and the supported formats.
Now that we know what we’re looking for let’s start our voyage into the deep waters of dashboarding.
Grafana
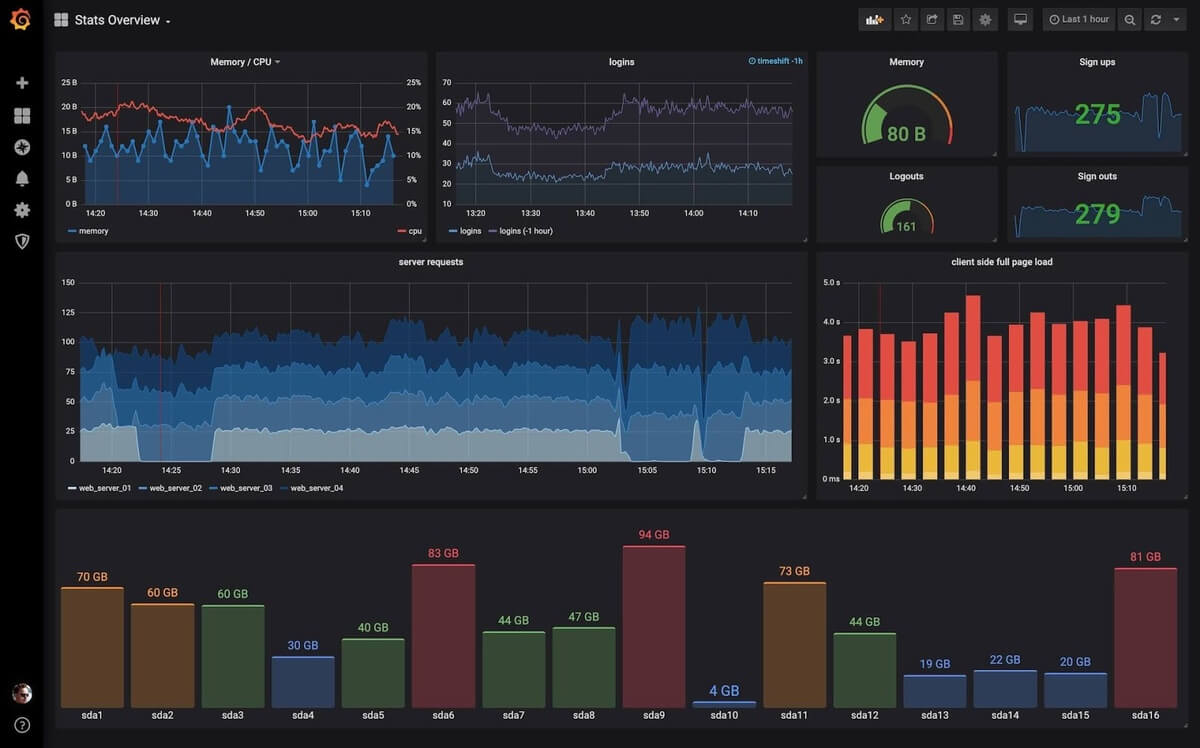
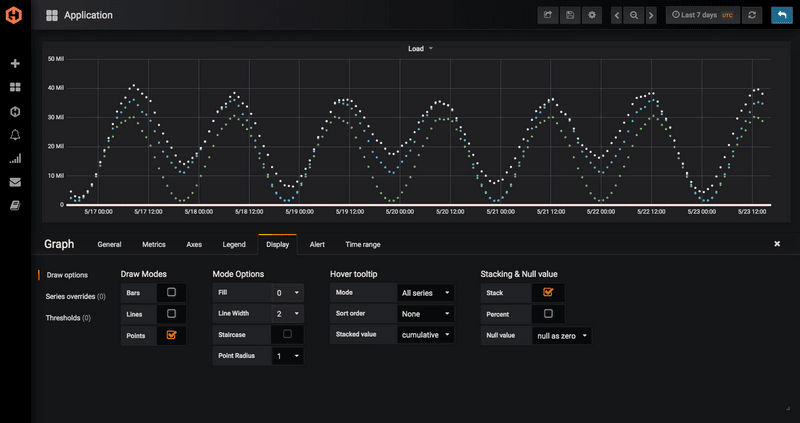
Boasting one of the most active developer communities with over 900 active developers and 30k stars on Github, Grafana is a powerful, feature-rich data visualization tool that allows users to create, explore, and share dashboards. Written mainly in Go and Typescript, it is used primarily to monitor server/architecture health but can also be used for different types of data visualization or metrics dashboards. It is helpful for any business owner or individual looking for a visualization tool to analyze business metrics, but it is most commonly used for infrastructure monitoring.
You can find out more about Grafana on their Website and GitHub.
Pros
- It provides an official Library with a plethora of dashboard templates and plugins.
- It supports many data sources and databases, including Prometheus, Graphite, ElasticSearch, OpenTSDB, InfluxDB, and many more.
- It provides users with the ability to custom-tailor their desktops for any business.
- It provides built-in user control and authentication mechanisms.
- It provides diverse features, including snapshots, data annotations, etc.
- It allows users to customize alerting and notifications.
Cons
- Grafana is a visualisation tool that does not support data collection or storage.
- The dashboard requires considerable time and is less effective than a quick solution.
While these disadvantages may seem wrong, there’s a good chance your organization will not have to deal with them. For instance, your data storage and collection needs are handled if you're already using Prometheus or Graphite. Similarly, setting up Grafana doesn’t have to be a hassle using a hosted service like MetricFire. With MetricFire, you get the same open-source Grafana dashboards with the benefits of great support and scalability for a lower cost.
Freeboard
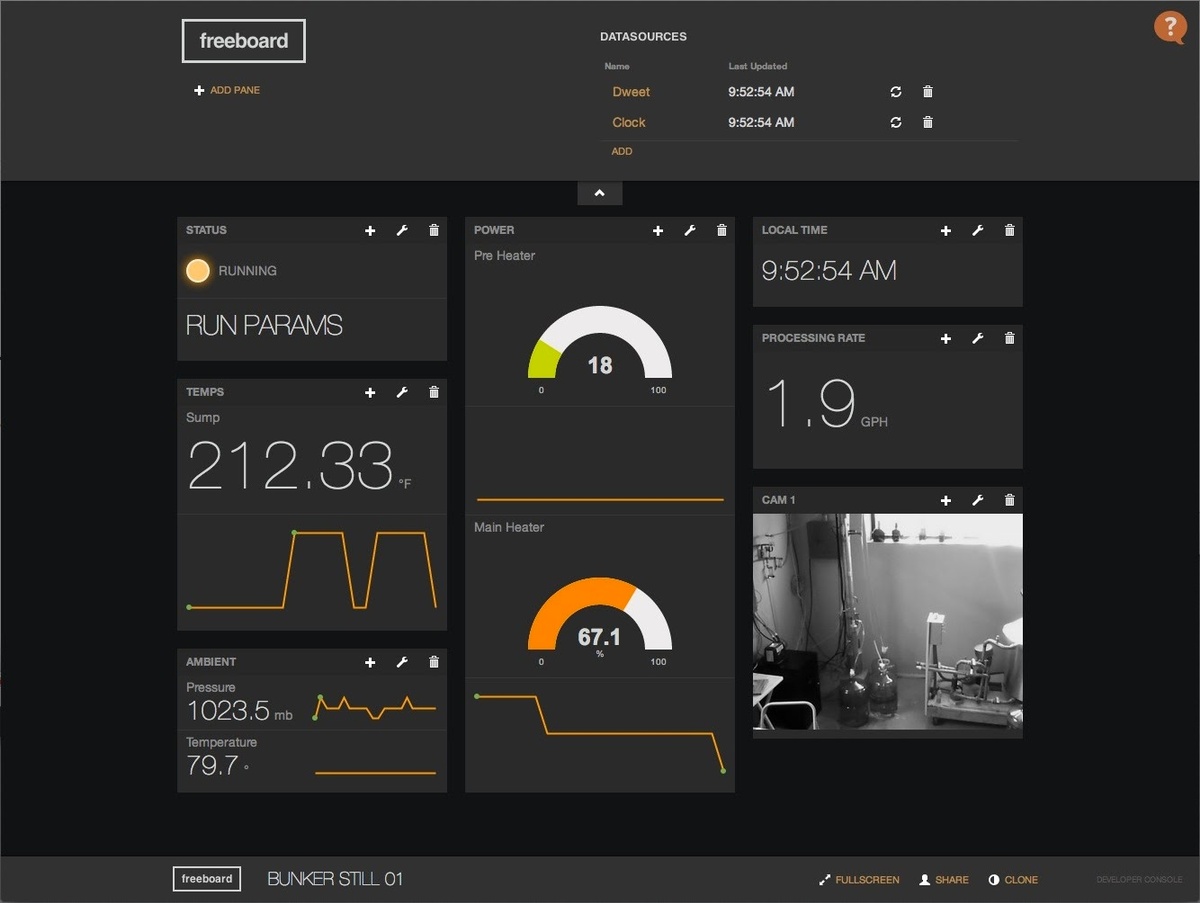
Let's start with a dashboard that boasts simplicity and ease of use as its best features. Freeboard is a simple, open-source dashboard tool that allows users to create and customize real-time interactive dashboards. It is primarily designed for IoT devices and is ideal for organizations and individuals working with web apps, external devices, or sensors. We liked the easy-to-use drag-and-drop interface provided by Freeboard and the free and paid hosted options for personal and team access to dashboards.
You can check out Freeboard on their Website or GitHub.
Pros
- You can easily create data sources and add widgets to your dashboards.
- The dashboard runs as a static web page, removing the need for a server.
- Easy integration with any web-based API you use.
- Licensed under MIT for users to utilize other Freeboards as a starting point for their dashboards. This can be a helpful feature for beginners & professionals alike.
- Freeboard also provides a production-ready dashboard with an easily shareable, unique URL, a feature we like.
- You get unlimited accessible dashboards that can be used on as many devices as possible.
Cons
- The free version does not provide support for private dashboards. We recommend the premium edition for handling sensitive data.
- A lack of data visualization capabilities in comparison to its competitors.
- Freeboard requires you to be familiar with the JavaScript ecosystem to create your plugins. However, it also provides an easy-to-follow plugin architecture in Plugin Example.
Mozaïk
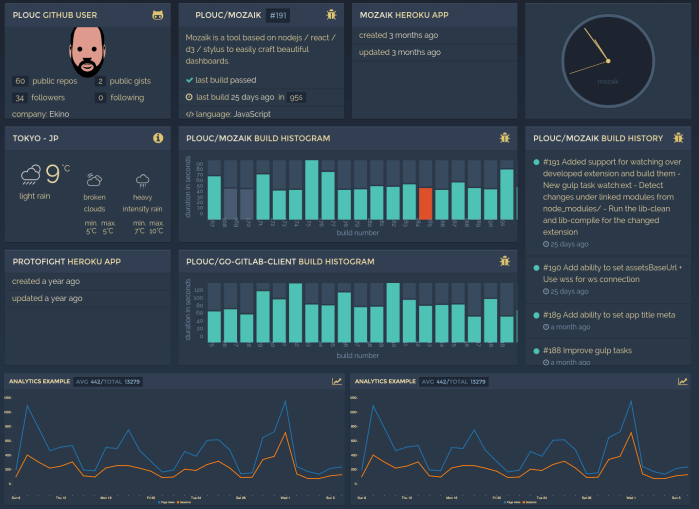
Mozaïk is a highly customizable dashboard tool built on the JavaScript trifecta of Node, React, and D3 to create beautifully crafted dashboards. The dashboards are designed to be easily scalable and extendable using modules and are compatible with multiple devices. We liked the simple, user-friendly interface and easily integrable widgets that Mozaïk provides.
You can learn more about Mozaïk at their Website and on GitHub.
Pros
- It provides users with the ability to create and use multiple dashboards.
- Optimized backend communications and real-time support using WebSockets.
- It provides a grid system to help users define their dashboard layout. A great feature that makes it easy for users to design their dashboards.
- It comes with six highly customizable themes and allows users to create them.
- It provides dashboards with a scalable layout that supports multiple devices.
- It provides a wide array of widgets that allow dashboards to access many services.
Cons
- Creating widgets that are not already available is challenging and requires a fair amount of coding know-how.
- A lack of data manipulation capabilities and advanced business metrics.
See if MetricFire is a good fit for your use case, and sign up for a free trial to start visualizing your data. Our support team will help you step by step. You can also book a demo and talk to us directly about what MetricFire can do for you.
Dashbuilder
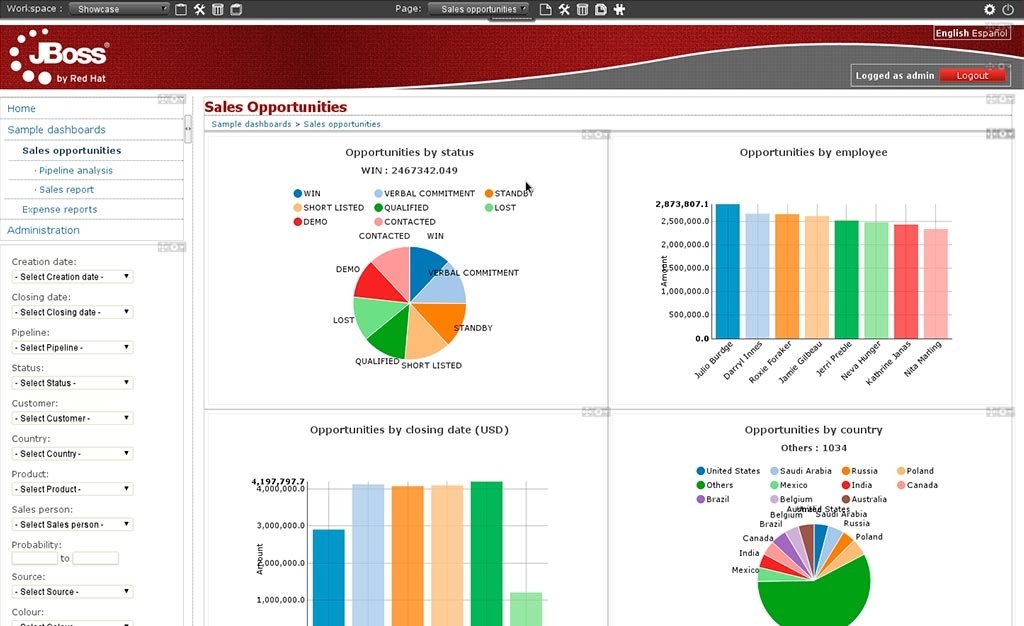
Next up is the dashboard tool made for non-technical users. Available under the Apache v2.0 License, Dashbuilder is a fully featured web app dashboard tool that allows users to create deployment-ready dashboards through a visual interface. It is a Java-based tool that creates highly customizable dashboards. The newer rewritten version, UF Dashbuilder, has more features and an even better user Interface. It's a great tool for business activity monitoring.
You can find out more about Dashbuilder on their Website and GitHub.
Pros
- It supports a variety of visualization tools and libraries.
- It can be used to create static or real-time dashboards with relative ease.
- It can take data from various sources, including JDBC databases and text files.
- It provides support for the inline creation and editing of KPIs.
- It provides fine-tuned access control features for multiple users and roles.
- It provides data export capabilities to Excel and CSV formats.
Cons
- Dashbuilder lacks integration possibilities for existing REST/SOAP systems.
- There is a lack of customization and personalization capabilities for users.
Stashboard
Unlike the other dashboards, Stashboard was initially written to provide information regarding phones and communication APIs. It is a tool for creating dashboards that provide status information about cloud services and APIs. It is a great tool, ideally for small—to medium-sized businesses that use cloud services or APIs and need to track the status of these services.
Check out their Website and GitHub for more information about Stashboard.
Pros
- It is designed to run as an independent application using Google App Engine. So, it will display the service status even if the main service goes down.
- It provides a full REST API for both getting and setting status information.
- It can track multiple APIs and SaaS services.
- It provides users with the ability to customize status messages and icons.
- It provides status history for every service which can be requested by the user at any time.
Cons
- It is limited in its application as it can only provide the status of different applications.
Re: Dash
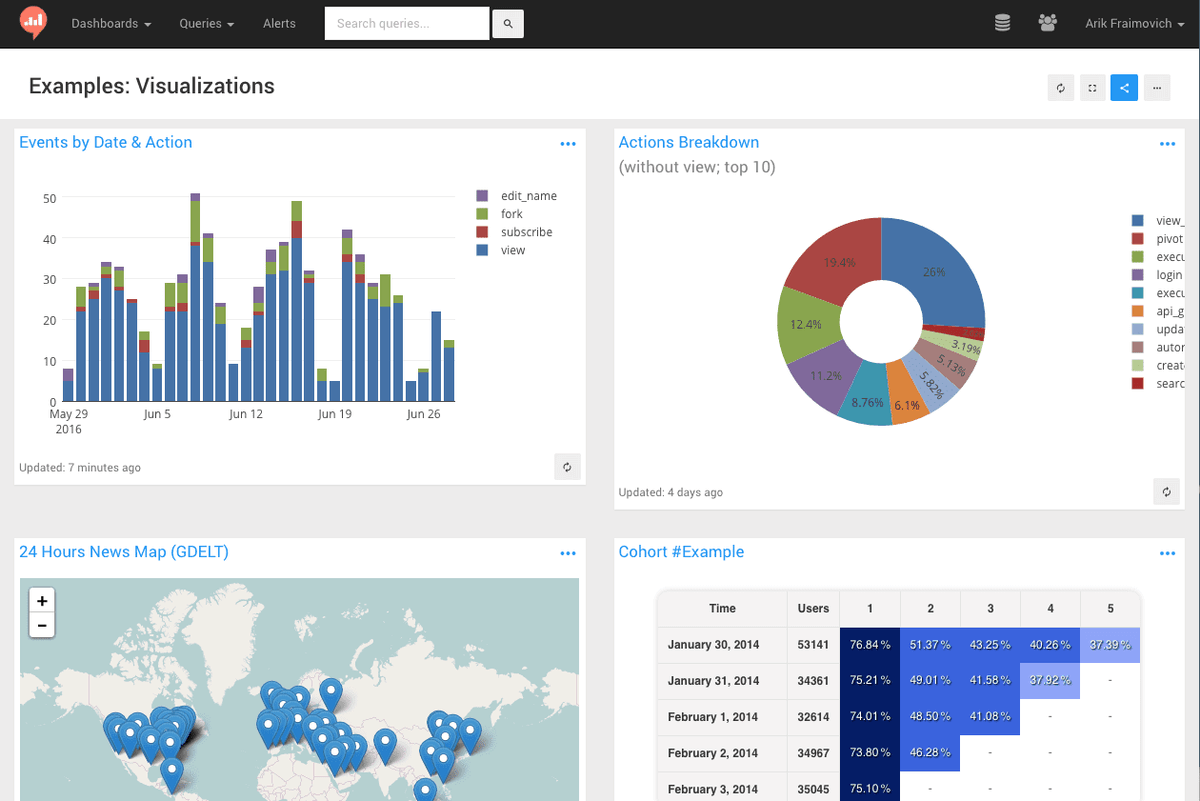
Re: Dash is an open-source dashboard tool that allows users to connect their data sources and visualize data on a single platform. It boasts an extensive collection of integrated databases, including PostgreSQL, MySQL, Google BigQuery, Graphite, ElasticSearch, MongoDB, Presto, InfluxDB, and many more.
You can learn more about Re: Dash at their Website and GitHub.
Pros
- Re: Dash is available as a SaaS and open-source self-hosted solution.
- It provides users many useful features, such as social sharing, customizability, drag-and-drop, and more.
- It provides robust data visualization features to the user.
- It allows users to write effective queries for the supported data sources.
Cons
- It lacks some Business Intelligence and data exploration features.
- A considerable amount of time must be invested to learn how to use the dashboard properly.
Kibana
The ELK stack represents the K in the world's leading log management platform, Kibana, a robust open-source data navigation and visualization application. It allows users to monitor and manage their ElasticStack data, making it an excellent tool for anyone using Elasticsearch or the ELK stack to manage their data.
Find out more about Kibana and the ELK stack at their Website and GitHub.
Pros
- It allows users to create ways of representing their data and figures in addition to the standard visualization tools.
- It lets users explore the relationships in their data.
- It requires no additional coding or infrastructure as it runs on a Node.js web server.
- It provides powerful anomaly detection features to detect issues in the data easily.
- It provides users with data-sharing capabilities, including some data export capabilities to PDF and CSV formats.
- It provides an efficient and easy-to-use single UI.
Cons
- The data exporting features are still limited.
- Since it works with ElasticStack, ElasticStack's limitations also affect Kibana.
Tipboard
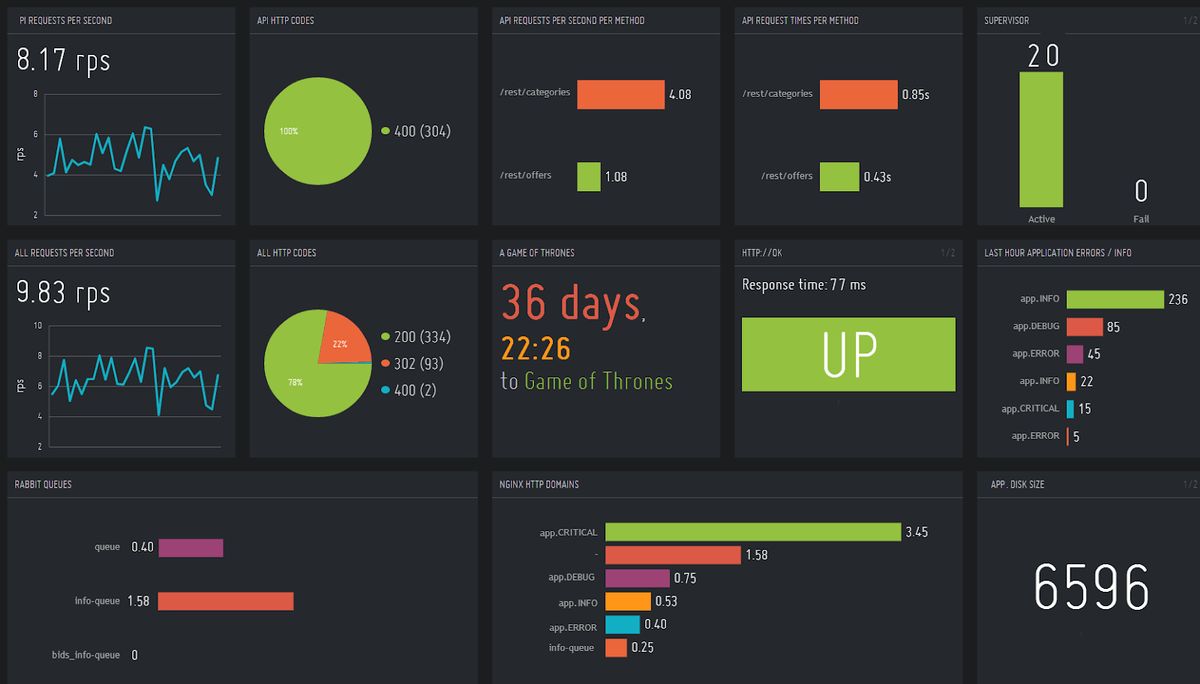
Next is the tool ranked #1 by slant.co for the best open-source dashboard framework. Written in JavaScript and Python, Tipboard is an open-source dashboard tool to create customizable and neat-looking business metric dashboards. The Tipboard widgets are separate from their data sources, which makes the dashboards flexible and highly customizable.
You can learn more about Tipboard from their Website and GitHub.
Pros
- Easy to configure and build dashboards using YAML.
- It is a self-hosted platform, so the user's data is safe.
- It allows users to create multiple dashboards in a single instance.
- It provides an HTTP API for pushing JSON data to the dashboard.
- It provides users with a library of widgets and the ability to create them.
Cons
- Tipboard is written in Python 2.7 and provides no Python 3 support.
Smashing
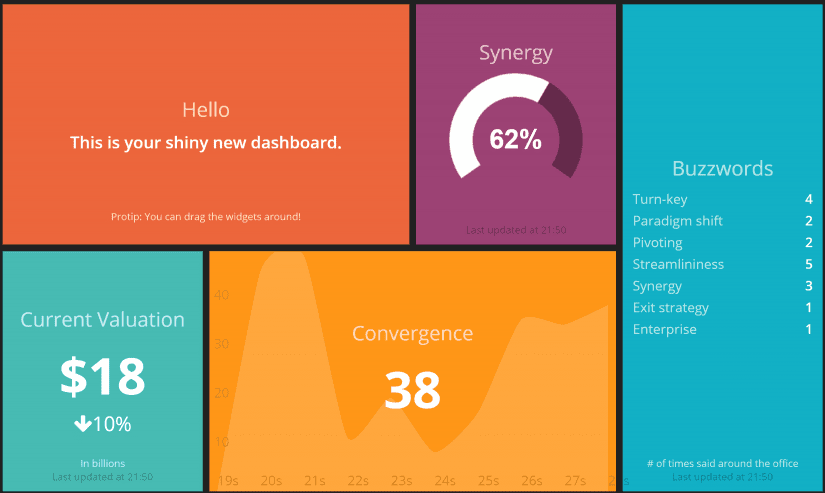
It’s time to meet the brother of one of the most beautiful dashboard tools, Dashing, which is now discontinued. Dubbed the spiritual successor to Dashing by its developers, Smashing is a Sinatra-based Dashboard tool that allows users to create aesthetically exceptional dashboards. Smashing provides users with comprehensive documentation, including a large variety of examples.
To learn more about Smashing, check out their Website and GitHub.
Pros
- It provides users with an enormous library of pre-made widgets and the ability to create them using HTML, SCSS, and CoffeeScript.
- It provides Heroku with simple and easy-to-use deployment capabilities.
- The widgets can be fed the required data directly using Ruby.
- It provides an easy-to-use drag-and-drop interface for arranging widgets and designing dashboards.
- It provides users with the ability to use their authentication for their boards.
- It provides users with an HTTP API to push JSON data on the dashboard.
Cons
- Smashing does not provide support for or run in any version of Internet Explorer.
MetricFire
Metricfire is a premium infrastructure monitoring platform that provides cloud-based infrastructure and application monitoring capabilities using open-source tools. It provides users with many business and infrastructure metrics using Hosted Graphite on beautifully crafted open-source Grafana dashboards. Check out our Website to learn more about MetricFire. Get a free trial and start making MetricFire dashboards right away. You can also book a demo if you have questions about what MetricFire can do. We're happy to answer all your monitoring questions!
Pros
- It provides users with long-term storage for their metrics and other related data.
- It provides excellent data security capabilities, including secure data transport over HTTPS connections.
- It allows users to create customizable alerts for actionable events in their metrics.
- It provides users with simple and easy-to-learn APIs to handle the monitoring.
- It provides users with sharing and access control capabilities.
- It provides a feature-rich, intuitive, and easy-to-use UI for users to create and manage their open-source Grafana dashboards easily.
- It provides users with affordable plans according to the size of their teams and level of monitoring, including custom plans for enterprise users.
Cons
- MetricFire is a premium service and does not provide free-to-use options. However, it provides a 14-day free trial for users who want to try the service before subscribing to the premium service.
Sign up for MetricFire's free trial and take a moment to book a demo now. If you’re already using Graphite, we can show you exactly how integration and hosted services can excel your ability to work with your data and metrics. And while we recommend vanilla Graphite due to its many advantages, you’ll see that MetricFire adds real value to your organization. Our support and the hosted solution are invaluable.
Choosing a Data Monitoring Service
The biggest questions regarding using MetricFire - and open-source Grafana - relate to the data monitoring service you use. We’ve already stated our belief that Graphite excels over Prometheus, but it’s essential to understand why we came to this conclusion. The following benefits will explain this decision in a way that will likely lead you to the exact inference:
- Prometheus can encounter security issues involving Kubernetes clusters if you're using a hosted service. Graphite does not.
- Graphite can have metrics pushed to it from any programming language.
- Graphite has existed longer and is more stable than Prometheus and other platforms.
- Many of Prometheus's benefits—such as Grafana dashboards and real-time monitoring of time series data—also exist with Graphite.
While Graphite may excel, the fact remains that both these platforms have a disadvantage: maintenance requirements. As open-source platforms, users typically have to handle installation and maintenance themselves. However, you’ll avoid these complex tasks using a hosting service like MetricFire. You’ll have the best tools on the market without any of the headaches typically experienced.
Conclusion
In our journey, we explored various dashboard tools meant for different purposes, providing different features, handling different data types, and being suitable for other types of users. No dashboard is perfect for everyone. Each one has its pros and cons. Find out what features are more critical to your work, and choose the dashboard that suits you the most.
Get a free trial with MetricFire and start visualizing your data. You can also book a demo and talk to us directly about what MetricFire can do for you.
This article was co-written by Nikhil Maan, & Vipul Gupta.
Vipul Gupta and Nikhil Maan are open-source developers and writers at Mixster. Mixster is an initiative to write better content for the open web. Starting in 2017, we collaborated and worked with early-stage startups and major open-source organizations on projects like with the fantastic folks at MetricFire. Let’s connect!


