Table of Contents
Introduction
Monitoring Kubernetes performance allows you to manage your applications smoothly. In this article, we will examine Kubernetes metrics every team should monitor and how to send K8s metrics to MetricFire for insights and visualization in Hosted Grafana.
K8s Overview
What is Kubernetes (K8s)?
Before we discuss monitoring K8s, we must understand K8s (or Kubernetes) and how it works. K8s is a software commonly used by developers for application deployment and management. For example, MetricFire uses K8s to manage our customers' Grafana instances. If you want to learn more about our use case with K8s, read here.
How Does K8s Work?
K8s provides APIs for managing application deployments and more. It also isolates networks for each application to ensure secure communication.
There are many reasons why someone may use K8s for their application. It allows for load balancing, added storage, automated rollouts, and more! If you want more information on how K8s works, see their docs.
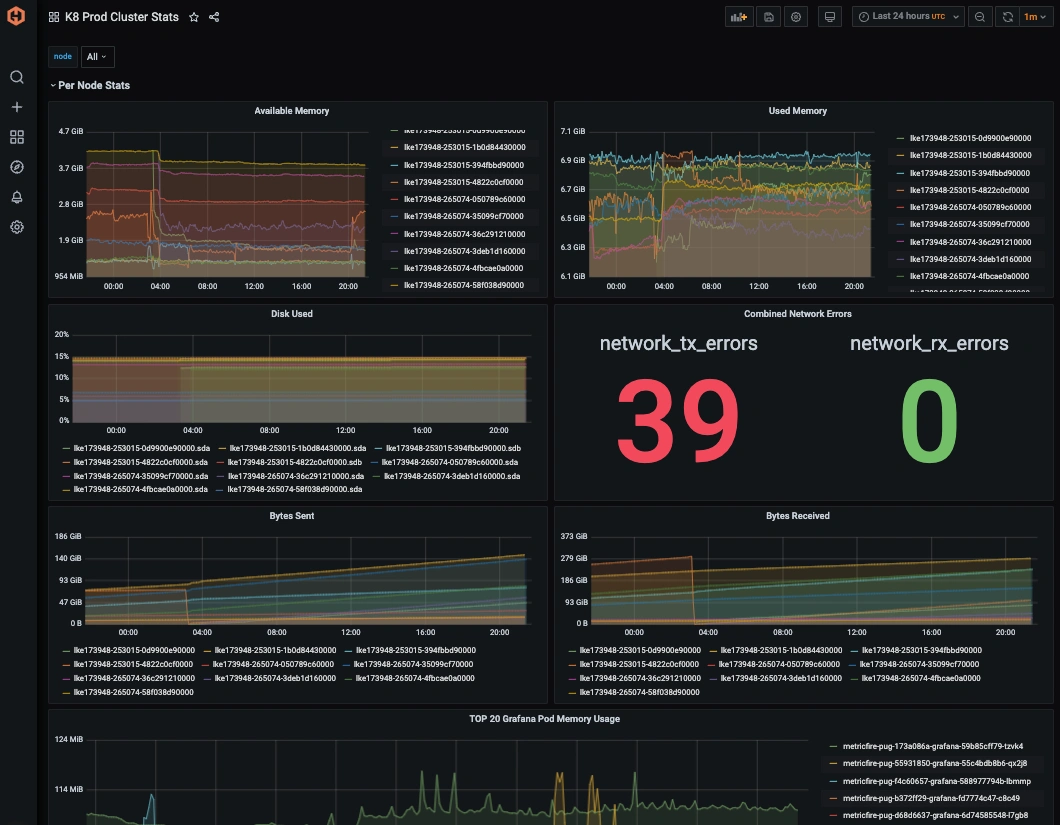
Top Kubernetes Performance Metrics
Let's look at some key performance metrics to monitor in Kubernetes.
- cpu_usage_nanocores: Tracks CPU usage in nanocores, helping you detect bottlenecks.
- memory_available_bytes: Displays the available memory, vital for identifying potential memory issues.
- memory_usage_bytes: Measures the total memory usage by containers.
- memory_rss_bytes: RSS (Resident Set Size) indicates the memory occupied in RAM.
- memory_page_faults: A high number of page faults could mean insufficient memory resources.
- network_rx_bytes: The total number of bytes received over the network.
- network_rx_errors: Network errors can indicate issues with connectivity or hardware.
- network_tx_bytes: The number of bytes transmitted over the network.
- network_tx_errors: Network transmission errors that could affect performance.
- cpu_usage_core_nanoseconds: Shows how long a container has used the CPU.
- memory_working_set_bytes: The amount of memory recently used by containers.
- memory_major_page_faults: Indicates critical memory issues that may impact performance.
These metrics provide insight into resource consumption, network activity, and potential bottlenecks. For more information, see an extensive list of available Kubernetes metrics on GitHub.
Why You Should Monitor Kubernetes
Too often, small teams choose to move forward with using tools like K8s without a monitoring solution, because they can handle the small amount of data or they think command line tools such as k9s will be sufficient. But as their businesses grows, so does their data. Many small teams migrate to a hosted solution because their limited resources prohibit the insight they need.
By monitoring K8s, your team can gain insights into your applications' management and deployment processes. For example, if you push a deployment with an error, you will want a monitoring tool to send alerts so your team can fix the problem. This real-time visibility helps prevent costly downtime and performance degradation.
With adequate monitoring, businesses can save valuable time and resources tracking down issues, which can impact user experience and operational efficiency.
Benefits of Using MetricFire for Kubernetes Monitoring
When you choose MetricFire, you can count on speedy and informative support. Choosing a hosted solution means your team doesn't have to worry about monitoring. MetricFire isn't just a platform; we are your partner for all your monitoring requirements.
MetricFire has improved standard Graphite and offers additional tools and features that provide our customers with a robust and well-rounded monitoring solution.
Getting Started with MetricFire
Getting started with MetricFire is easy! Sign up for a free cardless trial and reach out to our support! We can walk you through how to send your first metrics.
If you have questions about monitoring, we'd love to talk with you. Contact us on LinkedIn, Twitter, or Facebook, or book a call!
Conclusion
In this article, we discussed Kubernetes, some key k8s metrics to monitor, and why monitoring your k8s environment is crucial. With MetricFire, you can simplify the monitoring process and focus on growing your business.