Table of Contents
Introduction
Converting multiple data formats into one unified format makes software and DevOps monitoring so much easier, as it brings together all types of metrics for a smoother, more consistent analysis. This approach cuts down on the need for separate parsing setups, saving time and reducing complexity when it comes to managing configurations. It’s also a big help for scaling up—your monitoring tools can handle growing volumes of data without constant adjustments. Plus, having a single format means data flows faster and more accurately, letting teams catch performance issues sooner and respond quickly.
Telegraf's Exec input plugin is incredibly useful for this exact reason! It can convert data from prometheus, json, influx, csv, graphite, logfmt, nagios, xml, wavefront, sflow, dropwizard, and convert it to a specified output like influxdb, graphite, prometheus, kafka, cloudwatch, and more!
In this article, we'll detail how to use the Telegraf Exec input plugin to convert Prometheus, JSON, and CSV data to a Graphite format, and forward it to a Graphite datasource.
Getting Started with the Telegraf Agent
Telegraf is a plugin-driven server agent built on InfluxDB that collects and sends metrics/events from databases, systems, processes, devices, and applications. It is written in Go, compiles into a single binary with no external dependencies, and requires a minimal memory footprint. Telegraf is compatible with many operating systems and has many helpful output plugins and input plugins for collecting and forwarding a wide variety of system performance metrics.
Install Telegraf (Linux/Redhat)
/etc/telegraf/wget https://dl.influxdata.com/telegraf/releases/telegraf_1.30.0-1_amd64.deb
sudo dpkg -i telegraf_1.30.0-1_amd64.deb
RedHat/CentOS
wget https://dl.influxdata.com/telegraf/releases/telegraf-1.30.0-1.x86_64.rpm
sudo yum localinstall telegraf-1.30.0-1.x86_64.rpm
Configure an Output
You can configure Telegraf to output to various sources, such as Kafka, Graphite, InfluxDB, Prometheus, SQL, NoSQL, and more.
In this example, we will configure telegraf with a Graphite output. If you're not currently hosting your data source, start a 14-day free trial with Hosted Graphite by MetricFire to follow these next steps.
A Hosted Graphite account will provide the data source, offer an alerting feature, and include Hosted Grafana as a visualization tool.
To configure the Graphite output, locate the downloaded telegraf configuration file at /etc/telegraf/telegraf.conf and open it in your preferred text editor. Then, you will need to make the following changes to the file:
First, uncomment the line:
[[outputs.graphite]]
Next, uncomment and edit the server line to:
servers = ["carbon.hostedgraphite.com:2003"]
Finally, uncomment and edit the prefix line to:
prefix = "<YOUR_API_KEY>.telegraf"
Produce a Custom Prometheus Metric
This article assumes that you are producing your own custom prometheus metrics from your application or infrastructure. If you're just getting started and want to see a quick example of how to produce a prometheus metric and convert it to a new format, you can follow these simple steps:
- Create a simple Flask app that will produce a custom Prometheus metric:
- pip install Flask prometheus-client
- create a new file named app.py and add the following:
from flask import Flask, Response
from prometheus_client import Gauge, generate_latest, CONTENT_TYPE_LATEST

app = Flask(__name__)

# Example Prometheus metric: CPU temperature in Celsius
cpu_temperature_gauge = Gauge('cpu_temperature_celsius', 'Current CPU temperature in Celsius')
cpu_temperature_gauge.set(68.5)  # Sample value

@app.route('/metrics')
def metrics():
    # Return the metrics in Prometheus format
    return Response(generate_latest(), mimetype=CONTENT_TYPE_LATEST)

if __name__ == "__main__":
    app.run(host="0.0.0.0", port=5000)
- Execute the script to run the flask development server:
- python app.py
Convert/Forward the Prometheus Metric to Graphite
- In another terminal window, open the telegraf config file located at: /etc/telegraf/telegraf.conf
- Uncomment and configure the inputs.exec plugin:
[[inputs.exec]]
  commands = ["curl -s http://localhost:5000/metrics"]
  data_format = "prometheus"
You can now see the example custom Prometheus metric in your Hosted Graphite account in the Graphite data format:
telegraf.<host>.prometheus.cpu_temperature_celsius
This method lets you convert Prometheus metrics into a format that works with other tools, like Graphite, for easier integration. This keeps your metrics consistent and accessible, making it simpler to analyze trends and manage alerts across your monitoring setup. See the official GitHub documentation for more information on the Telegraf inputs.exec plugin
Produce Example JSON Metrics
This article assumes that you're already collecting JSON data from your application, infrastructure, or a 3rd party API. If you're just getting started and want to see a quick example of how to produce JSON metrics and convert them to another format, you can follow these simple steps:
- Create a new file named generate-json.sh and add the following:
#!/bin/bash

# Simulate values for CPU and memory usage metrics
cpu_usage=$(awk -v min=1 -v max=100 'BEGIN{srand(); print int(min+rand()*(max-min+1))}')
memory_usage=$(awk -v min=100 -v max=8000 'BEGIN{srand(); print int(min+rand()*(max-min+1))}')

# Output metrics in a JSON array format
echo '{
  "metrics": [
    {
      "name": "cpu_usage_percent",
      "value": '"$cpu_usage"'
    },
    {
      "name": "memory_usage_mb",
      "value": '"$memory_usage"'
    }
  ]
}'
- Make the script executable: sudo chmod +x generate-json.sh
- Run the script to see a JSON output: ./generate-json.sh
Convert/Forward the JSON Metrics to Graphite
- Modify the telegraf config file located at: /etc/telegraf/telegraf.conf
- uncomment and configure the inputs.exec plugin:
[[inputs.exec]]
  commands = ["/etc/telegraf/generate-json.sh"]
  data_format = "json"
  json_query = "metrics"
  tag_keys = ["name"]
  name_override = "custom_json_metrics"
You can now see the example custom JSON metrics in your Hosted Graphite account in the Graphite data format:
telegraf.<host>.cpu_usage_percent.custom_json_metrics
telegraf.<host>.memory_usage_mb.custom_json_metrics
This method lets you convert JSON data into a format that works with other tools, like Graphite, for easier integration. See the official GitHub documentation for more information on the Telegraf inputs.exec plugin
Produce Custom CSV Metrics
This article assumes that you're already collecting CSV files from your application, infrastructure, or a 3rd party API. If you're just getting started and want to see a quick example of how to produce CSV example data and convert it to a new format, you can follow these simple steps:
- Create a new file named metrics.csv and add the following:
metric_name,value
cpu_usage,42
memory_usage,756
disk_usage,125
- Create a script named read_csv.sh to read the CSV file, make sure to add the correct path:
#!/bin/bash
cat /path/to/metrics.csv
- Make the script executable: sudo chmod +x read_csv.sh
Convert/Forward the CSV Metrics to Graphite
- Modify the telegraf config file located at: /etc/telegraf/telegraf.conf
- uncomment and configure the inputs.exec plugin:
[[inputs.exec]]
  commands = ["/path/to/read_csv.sh"]
  data_format = "csv"
  csv_header_row_count = 1              # skip header row
  csv_column_names = ["name", "value"]  # define columns
  csv_tag_columns = ["name"]            # use 'name' as a tag
  name_override = "custom_csv_metrics"  # improve metric searchability
You can now see the example custom CSV metrics in your Hosted Graphite account in the Graphite data format:
telegraf.<host>.cpu_usage.custom_csv_metrics
telegraf.<host>.disk_usage.custom_csv_metrics
telegraf.<host>.memory_usage.custom_csv_metrics
This method lets you convert CSV data into a format that works with other tools, like Graphite, for easier integration. See the official GitHub documentation for more information on the Telegraf inputs.exec plugin
Use Hosted Graphite by MetricFire to Create Custom Dashboards and Alerts
MetricFire is a monitoring platform that enables you to gather, visualize and analyze metrics and data from servers, databases, networks, processes, devices, and applications. Using MetricFire, you can effortlessly identify problems and optimize resources within your infrastructure. Hosted Graphite by MetricFire removes the burden of self-hosting your monitoring solution, allowing you more time and freedom to work on your most important tasks.
Once you have signed up for a Hosted Graphite account and used the above steps to configure your server(s) with the Telegraf Agent, metrics will be forwarded, timestamped, and aggregated into the Hosted Graphite backend.
-
Metrics will be sent and stored in the Graphite format of: metric.name.path <numeric-value> <unix-timestamp>
-
The dot notation format provides a tree-like data structure, making it efficient to query
-
Metrics are stored in your Hosted Graphite account for two years, and you can use them to create custom Alerts and Grafana dashboards.
Build Dashboards in Hosted Graphite's Hosted Grafana
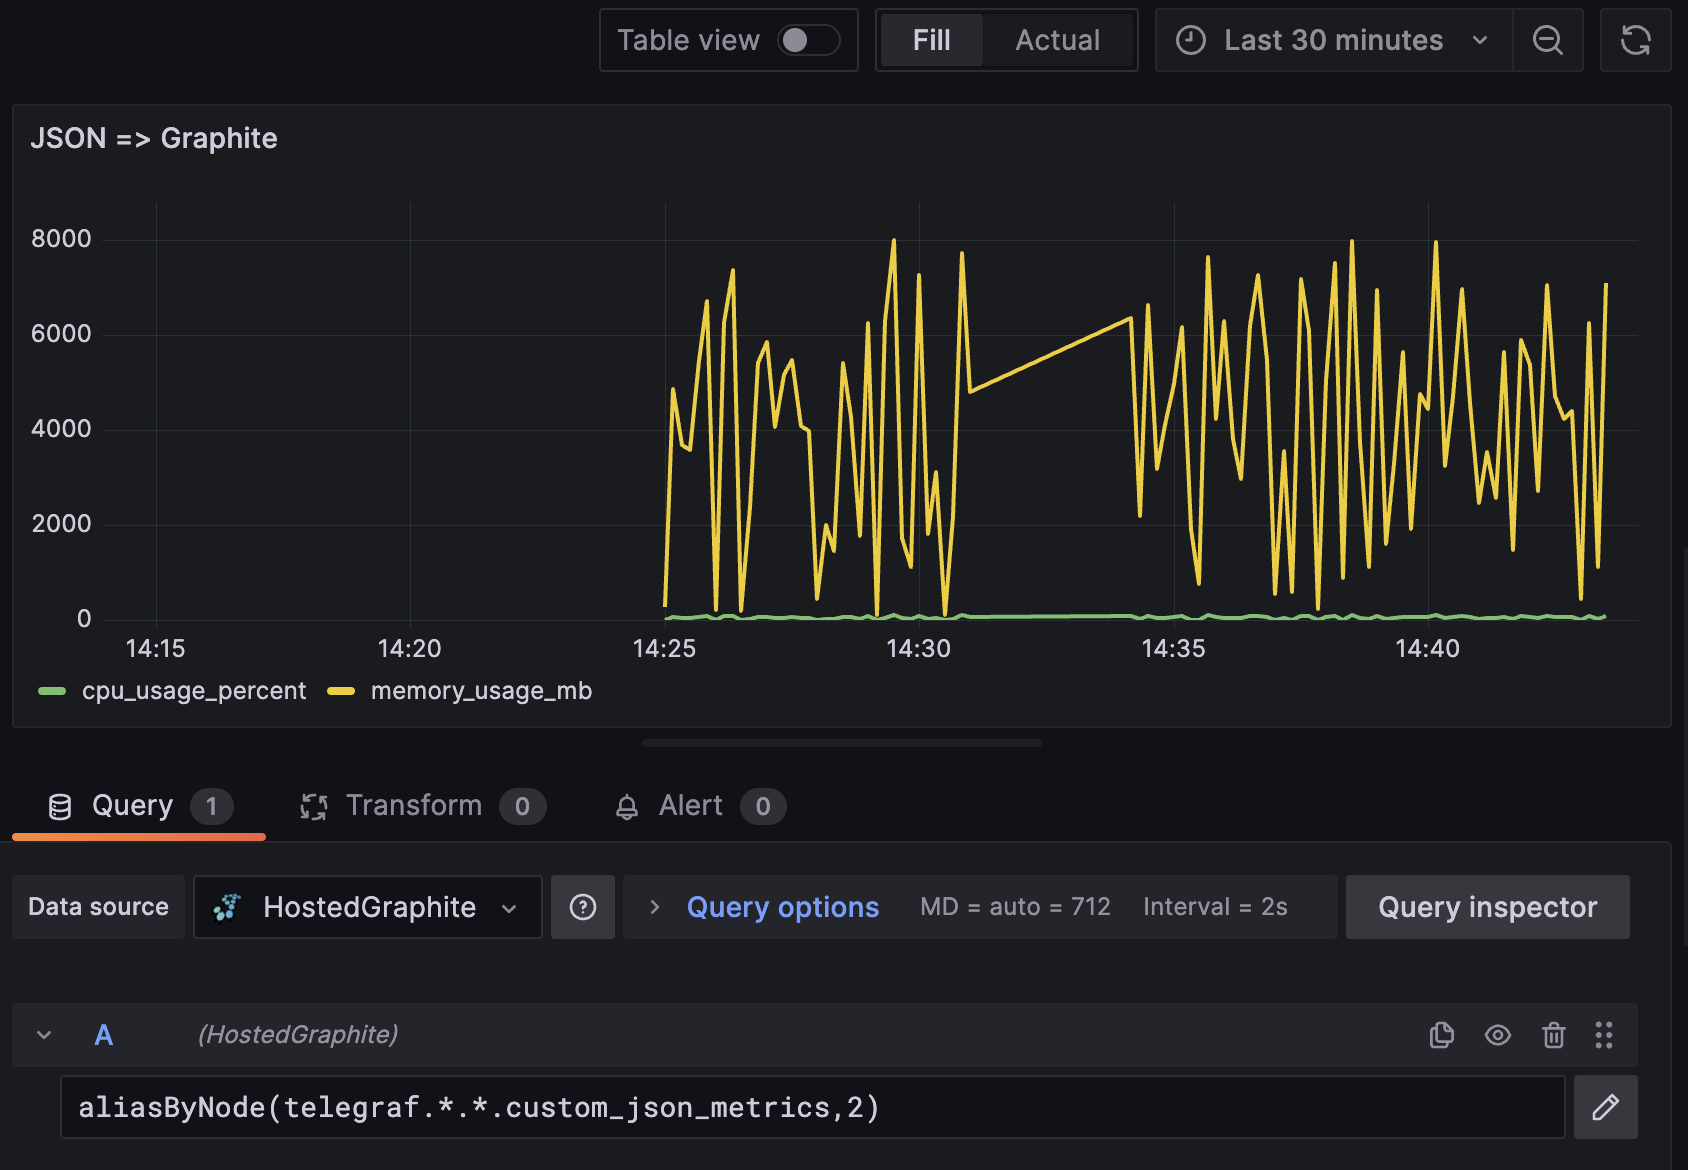
In the Hosted Graphite UI, navigate to Dashboards and select + New Dashboard to create a new visualization.
Then go into Edit mode and use the Query UI to select a graphite metric path (the default data source will be the HostedGraphite backend if you are accessing Grafana via your HG account).
The HG datasource also supports wildcard (*) searching to grab all metrics that match a specified path.
Now you can apply Graphite functions to these metrics like aliasByNode() to reformat the metric name:
Grafana has many additional options to apply different visualizations, modify the display, set units of measurement, and some more advanced features like configuring dashboard variables and event annotations. See the Hosted Graphite dashboard docs for more details.
Creating Graphite Alerts
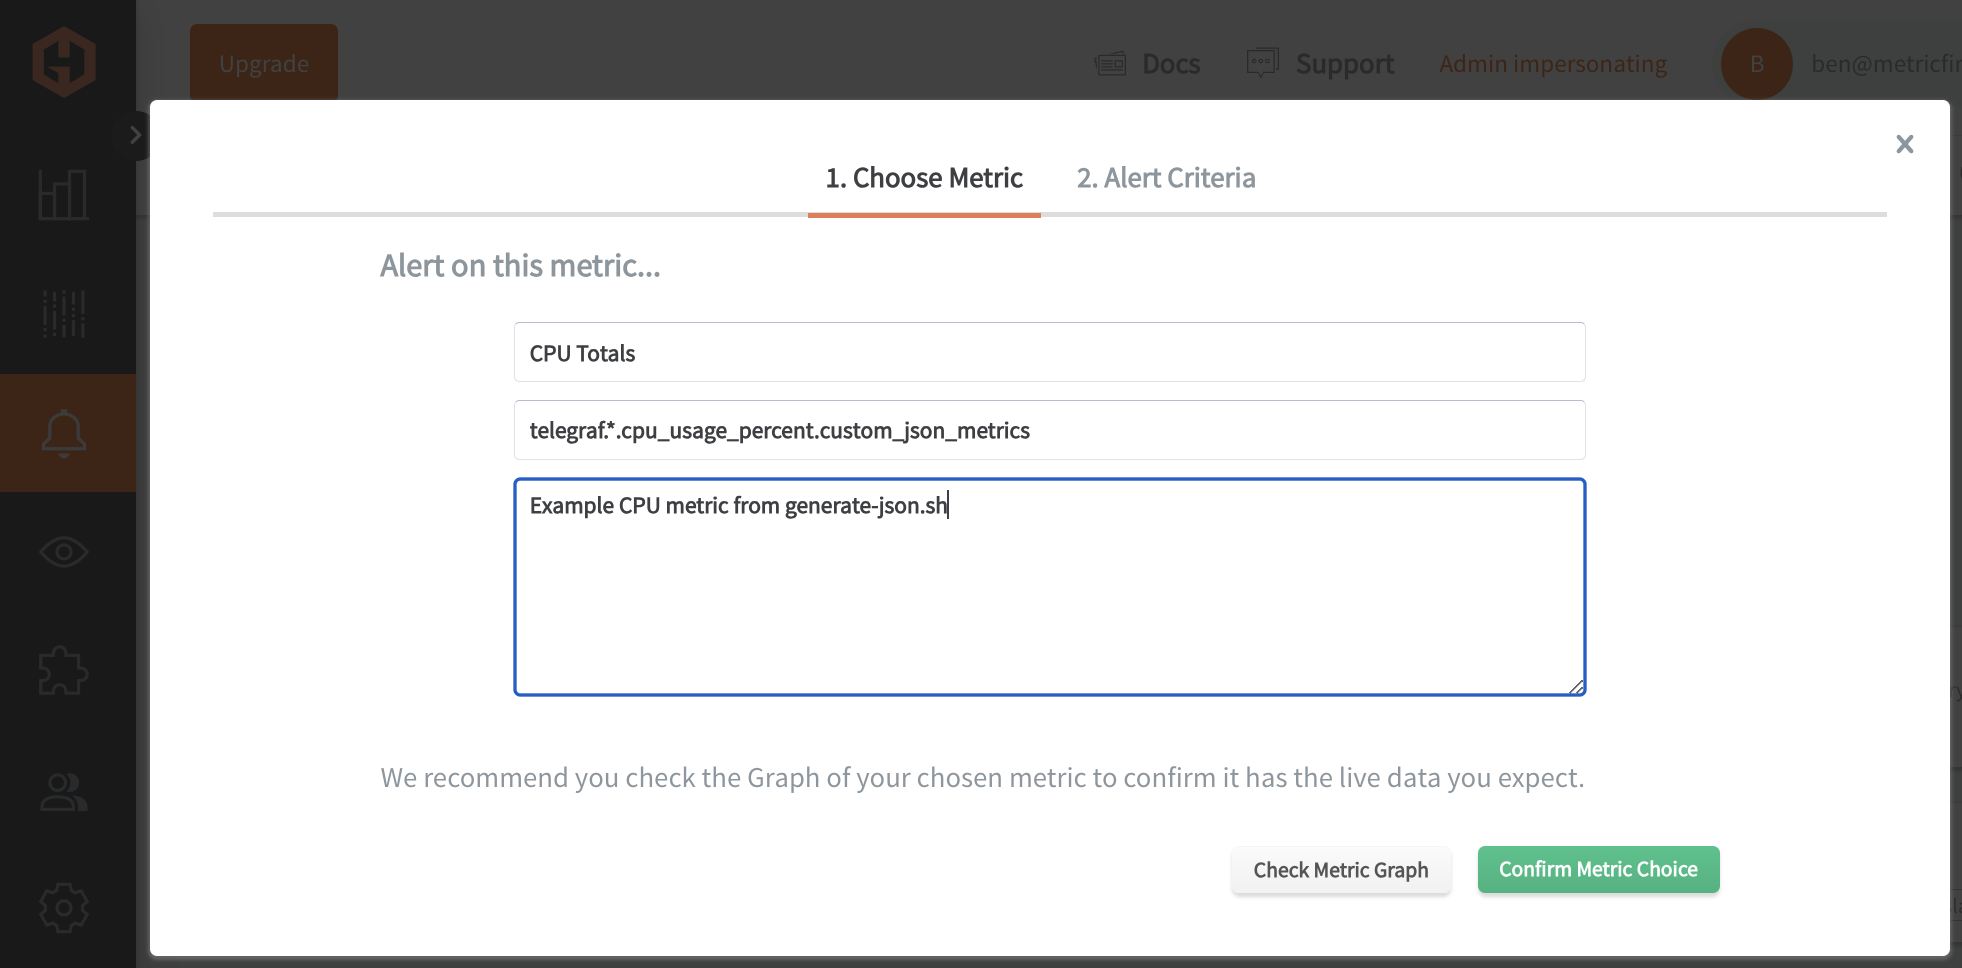
In the Hosted Graphite UI, navigate to Alerts => Graphite Alerts to create a new alert. Name the alert, add a query to the alerting metric field, and add a description of what this alert is:
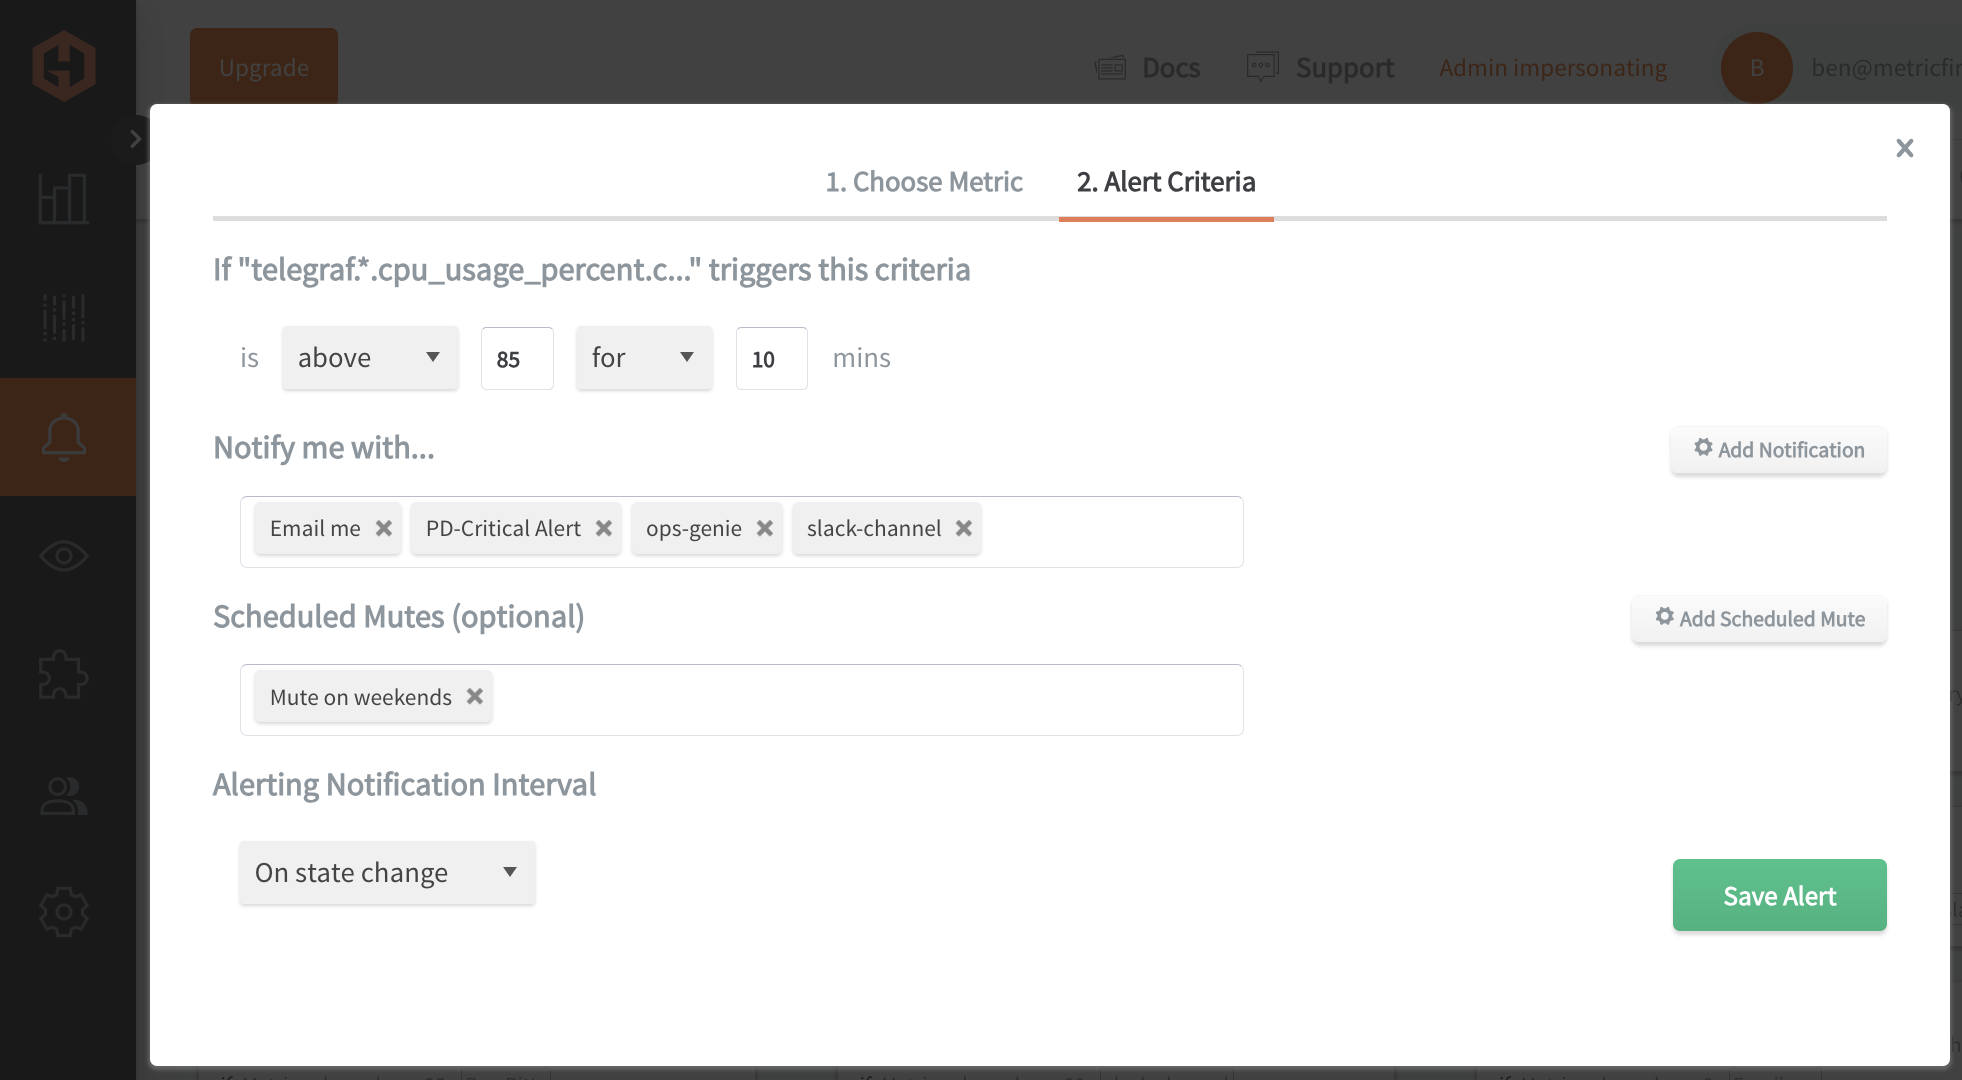
Then, select the Alert Criteria tab to set a threshold and select a notification channel. The default notification channel will be the email you used to sign up for the Hosted Graphite account. Still, you can easily configure channels for Slack, PagerDuty, Microsoft Teams, OpsGenie, custom webhooks and more. See the Hosted Graphite docs for more details on notification channels:
Conclusion
Streamlining your data into a single format for infrastructure monitoring makes it easier to manage, visualize, and act on key metrics across your environment. It reduces complexity, minimizes configuration time, and ensures that all metrics flow smoothly into one consistent system. Ultimately, this unified approach helps teams respond faster to issues and maintain a more reliable, efficient monitoring process.
Sign up for the free trial and begin monitoring your infrastructure today. You can also book a demo and talk to the MetricFire team directly about your monitoring needs.


