+

Monitoring GitHub with Slack

Integrating GitHub and Slack with your monitoring system

To integrate GitHub and Slack with your monitoring system, please reach out to MetricFire. Book a demo with the MetricFire team to discuss integrating GitHub and Slack and how that can support your monitoring system.

What is GitHub?

Visualize GitHub Events with Webhooks

MetricFire makes it easy to collect data from your repositories, and visualize GitHub events in the form of dashboard annotations. To enable our webhook integration, copy the webhook from Add-Ons => GitHub in your Hosted Graphite account:


github-webhook


Then add the webhook to your GitHub repo, in the ‘settings’ section => ‘webhooks’
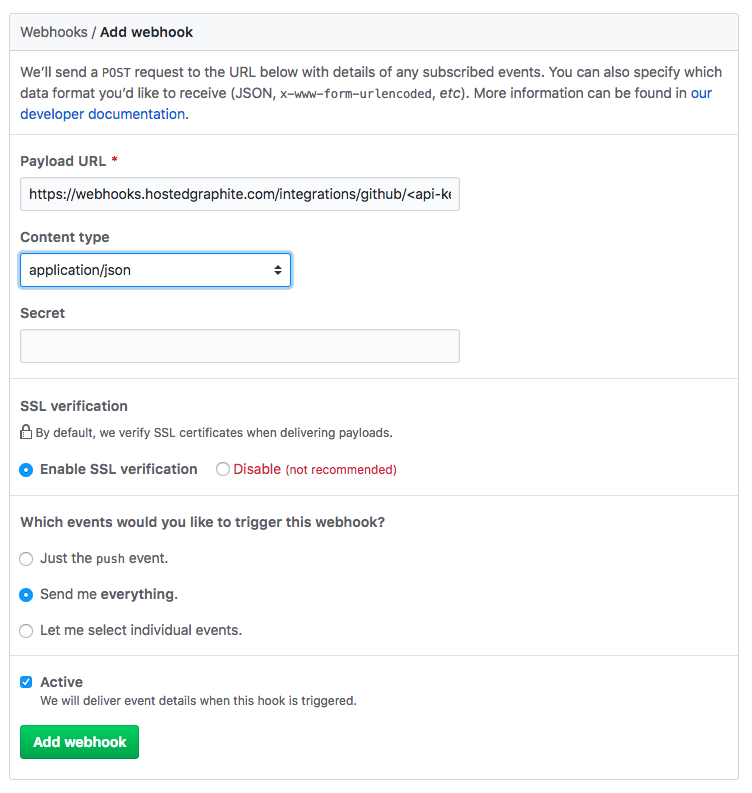
 

github-webhook-config 


Now you can save, and your GitHub events will now be sent to the webhook URL and saved on your account as Annotations. Use the following tags to query the annotations you want to display:


  1. Push Event Tags – ‘github’, ‘push’, <repo>, <branch>, <user>
  2. PR Event Tags – ‘github’, ‘pull-request’, <action>, <repo>, <user>
  3. Deploy Event Tags – ‘github’, ‘deployment’, <status>, <repo>, <user>, <environment>


 github-annotation-config


Visualize GitHub Metrics using the Telegraf Agent

Additionally, there is also a Telegraf Input plugin for GitHub. This plugin will send a variety of metrics to your Hosted Graphite account for increased visibility into your repositories. See our handy blog article with detailed configuration instructions HERE, and the official GH repository HERE.


github-example-dash

What is Slack?

Forward Hosted Graphite Alert Notifications to your Slack Channels

Hosted Graphite by MetricFire offers an integration that allows you to forward alert notifications to a Slack channel using a webhook. This can be configured in a few simple steps:


  1. Follow the Slack documentation to create a new app webhook HERE.
  2. Then navigate to Alerts => Notification Channels within your Hosted Graphite account, + Add Channel, and select 'Slack'.
  3. Name the channel, paste your webhook in the field, and hit 'Save'.


notification-channel

What is MetricFire?

MetricFire is a full-scale platform that provides infrastructure, system, and application monitoring using a suite of open-source tools. We will aggregate and store your data as time series metrics, which can be used to build custom dashboards and alerts. MetricFire takes away the burden of self-hosting your own monitoring solution, allowing you more time and freedom to work on your most important tasks.


     hg-main-page


MetricFire offers a complete ecosystem of end-to-end infrastructure monitoring, comprised of open-source Graphite and Grafana. MetricFire handles the aggregation, storage, and backups of your data, and offers alerting, team features, and API's for easy management of your monitoring environment. You can send server metrics using one of our agents, custom metrics from within your application code, and integration metrics from a variety of popular 3rd party services that we integrate with like Heroku, AWS, Azure, GCP, and many more!


Our Hosted Graphite product has improved upon standard Graphite to add data dimensionality, optimized storage, and offers additional tools and features that provide customers with a robust and well-rounded monitoring solution.


Benefits of Using MetricFire:

  • Simple, low-cost pricing
    A structured pricing model based on total unique time series metrics allows you to work within your budget. The predictability and transparent pricing allows you to keep your costs in check and plan for the future. 1 metric is 1 metric regardless of the source, or requests sent to and from the metric namespace.
  • Easy-to-use dashboards
    Our Hosted Dashboards provide endless options for customizing your visualizations, and allow you to share dashboards with clients.
  • Responsive alerting
    Receive alert notifications quickly through Email, PagerDuty, Slack, Microsoft Teams, OpsGenie, and custom webhooks.
  • Freedom of customization
    Send custom application metrics through your code. Our Language Guide can help you update your codebase to send event metrics via socket connections.
  • Fantastic customer support
    Fast and friendly support is provided by engineers, for engineers, to get you set up quickly. Start a conversation with us through the chat bubble below!
  • Enterprise-ready
    Dedicated clusters for users that need their own environment with custom parameters. Please reach out to us for more information.
      
The author for this testimonial, Jim Davies, Head of DevOps, MoneySuperMarket.com.
“As MetricFire scales effortlessly, we can push and store more metrics than we really need today but might need tomorrow. This increases our depth of understanding of the systems that we run and heads off any future problems.”
Jim Davies, Head of DevOps, MoneySuperMarket.com.

Don't just take our word for it

Why thousands of engineers choose us:

fingerprint icon Own your data
dollar icon Major savings
eye icon Nothing hidden
face icon Engineering support

Vendor lock-in's not our thing. We’re believers in you still owning your data, so you can request a full export at any time. That means you get all the benefits of an open-source tool, but with the security and stability of a SaaS tool.

“We now have over ten times the amount of metrics we started with, and on different accounts. One of the great things about MetricFire is that scaling to support this increase has been hassle-free, requiring no additional work on our side.”

Maxime Audet, Cloud-Ops Team Lead, Coveo

Read customer story Customer photo of Maxime

Save valuable engineering time and stick within your budget. We're known for our predictable and transparent pricing so it's easy to keeps costs under control.

“Building and managing an on-premise installation at this scale would require a lot of engineer time, especially in the first year...we use this engineering time to work on initiatives closer to our core business”

Jim Davies, Head of DevOps, MoneySuperMarket.com

Read customer story Customer photo of Jim

Transparency is at the root of how we operate: from pricing to postmortems we're open about how we do things. We even publish our internal system metrics to our public status page.

“There’s complete transparency with everything MetricFire do which means we can accurately predict what we’ll be spending and comfortably keep within our budget.”

Itai Yaffe, Big Data Developer, Nielsen

Read customer story Customer photo of Itai

Our first line, technical support comes from engineers, for engineers. So you get highly detailed, expert support when you need it.

"Every time I have a question, I get an answer from support after just a couple of hours. Their technical knowledge is excellent.”

Shahar Kobrinsky, VP of Architecture and Scale, Eyeview

Read customer story Customer photo of Shahar

Questions?

Don’t see the integration you’re looking for? Need help setting up your monitoring? Get in touch and one of our engineers will help you out.

Contact us
You might also like other posts...
metricfire Dec 06, 2024 · 6 min read

Step by Step Guide to Monitoring Apache Spark with MetricFire

Monitoring Spark metrics is crucial because it provides visibility into how your cluster and... Continue Reading

Do more with MetricFire